Sentio Debugger
Basic
Sentio debugger is a tool that helps developers understand how transactions work.
Search for specific transactions on the Explorer page
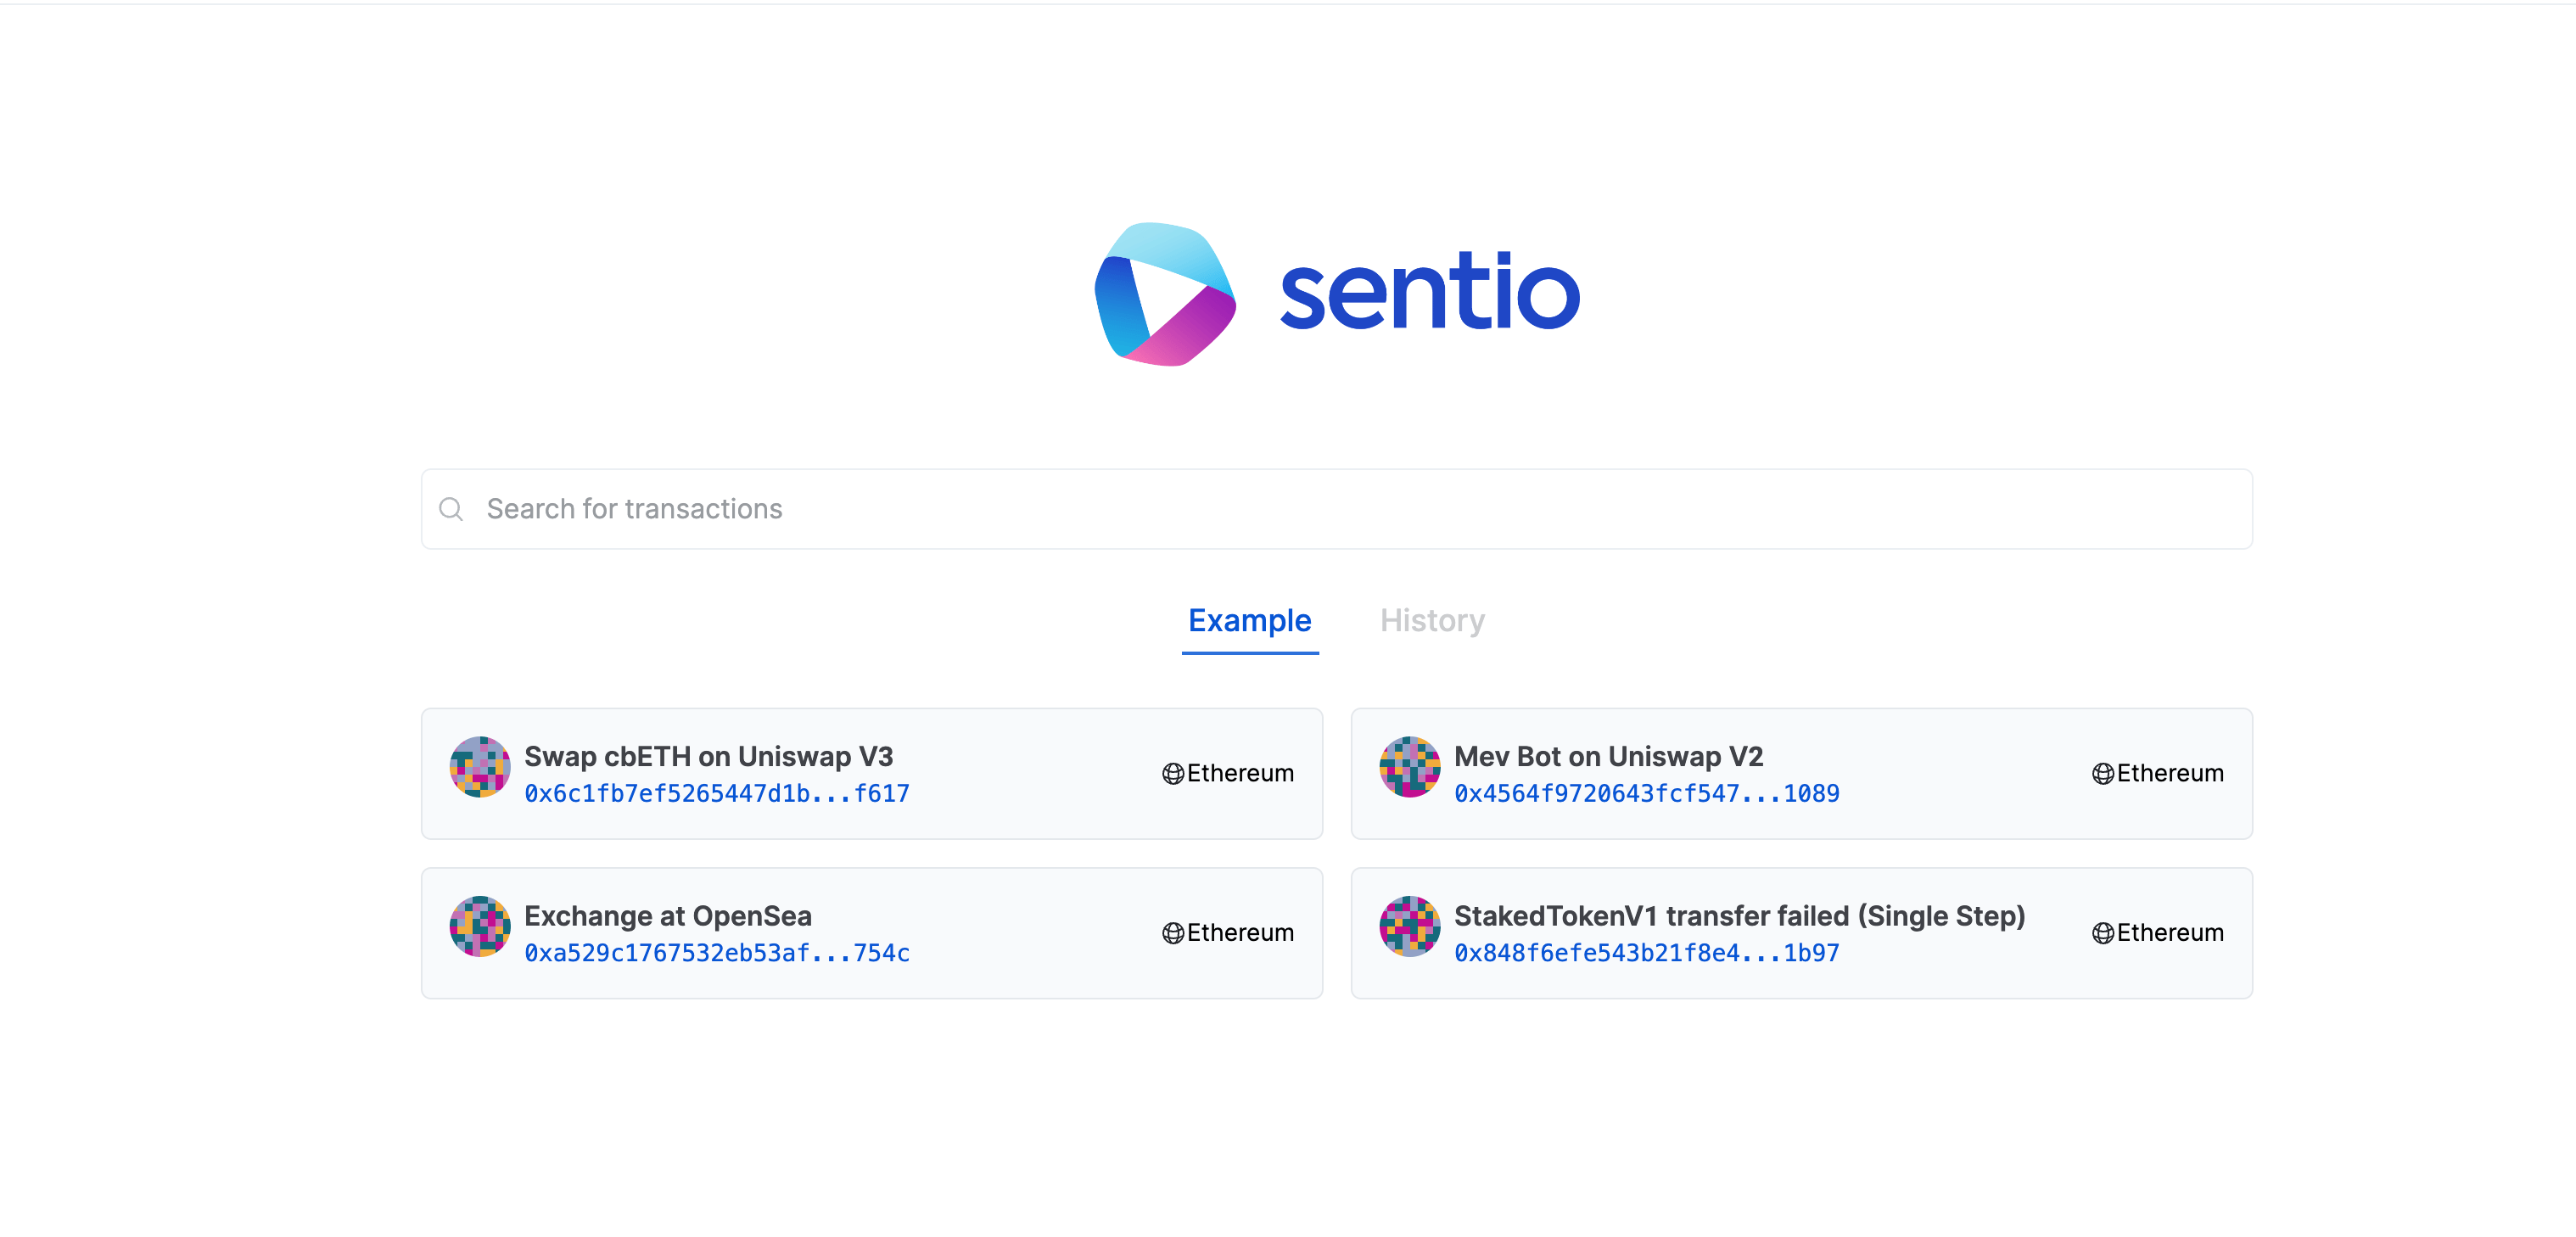
The Transaction Explorer has a few key features, including:
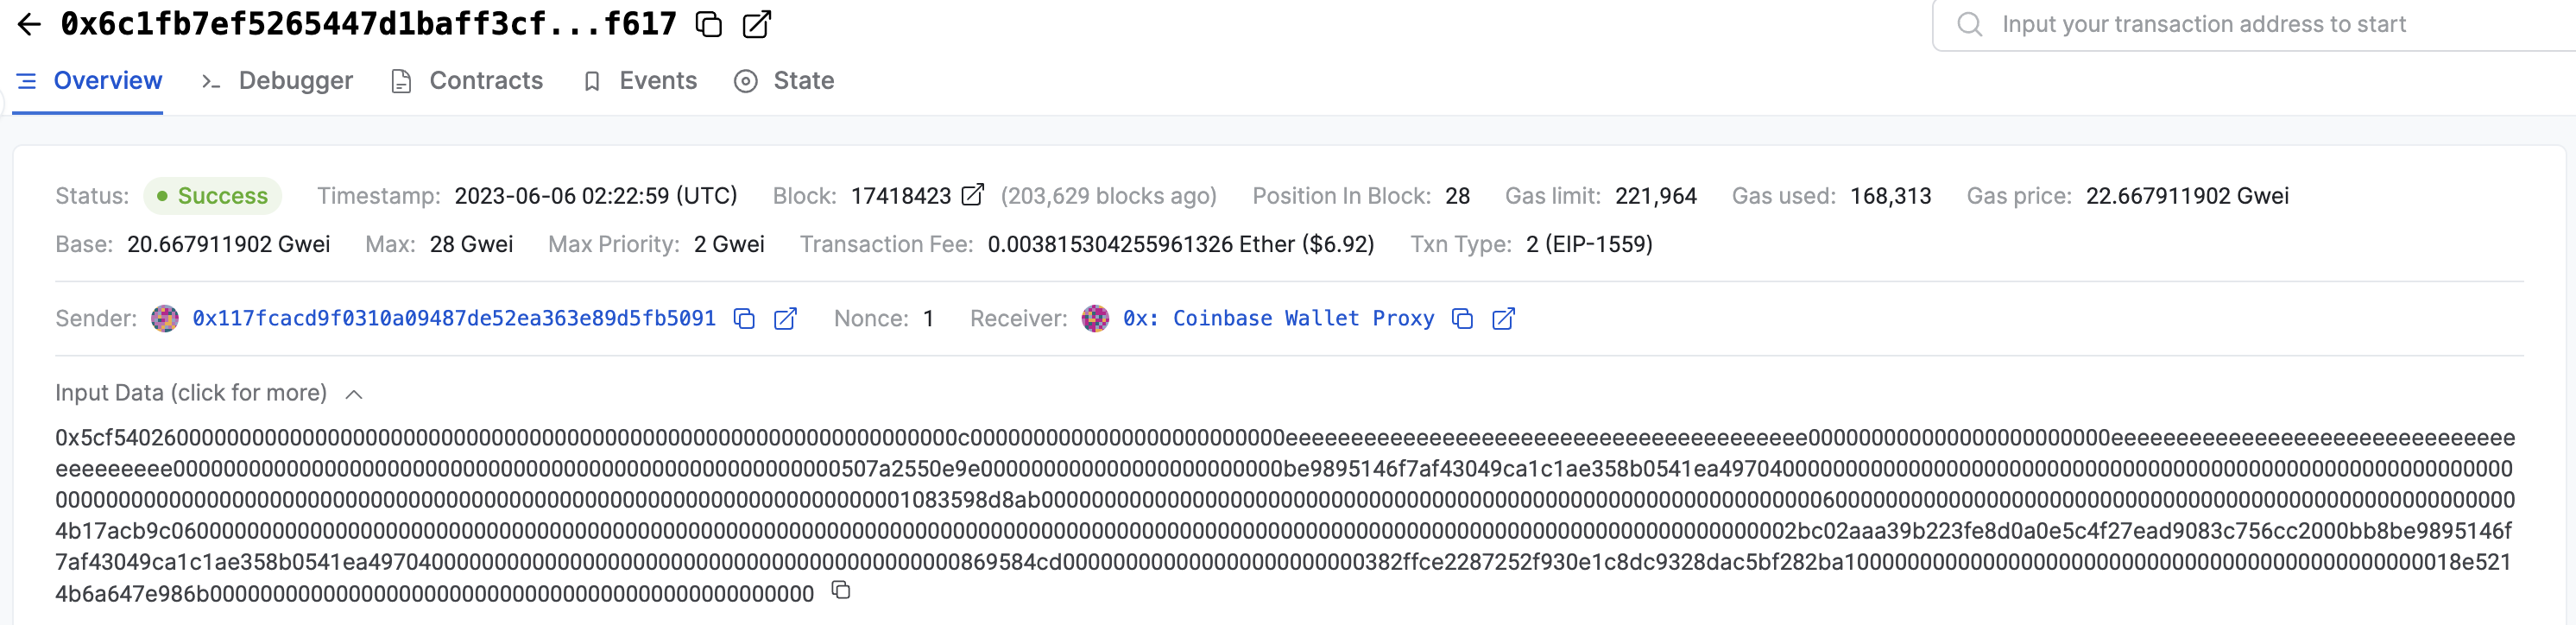
Transaction Information
Sentio provides standard information about specific transactions.
Transaction Metadata
For each transaction, Sentio adds standard transaction metadata, and a link to the block explorer page on the Overview tab.
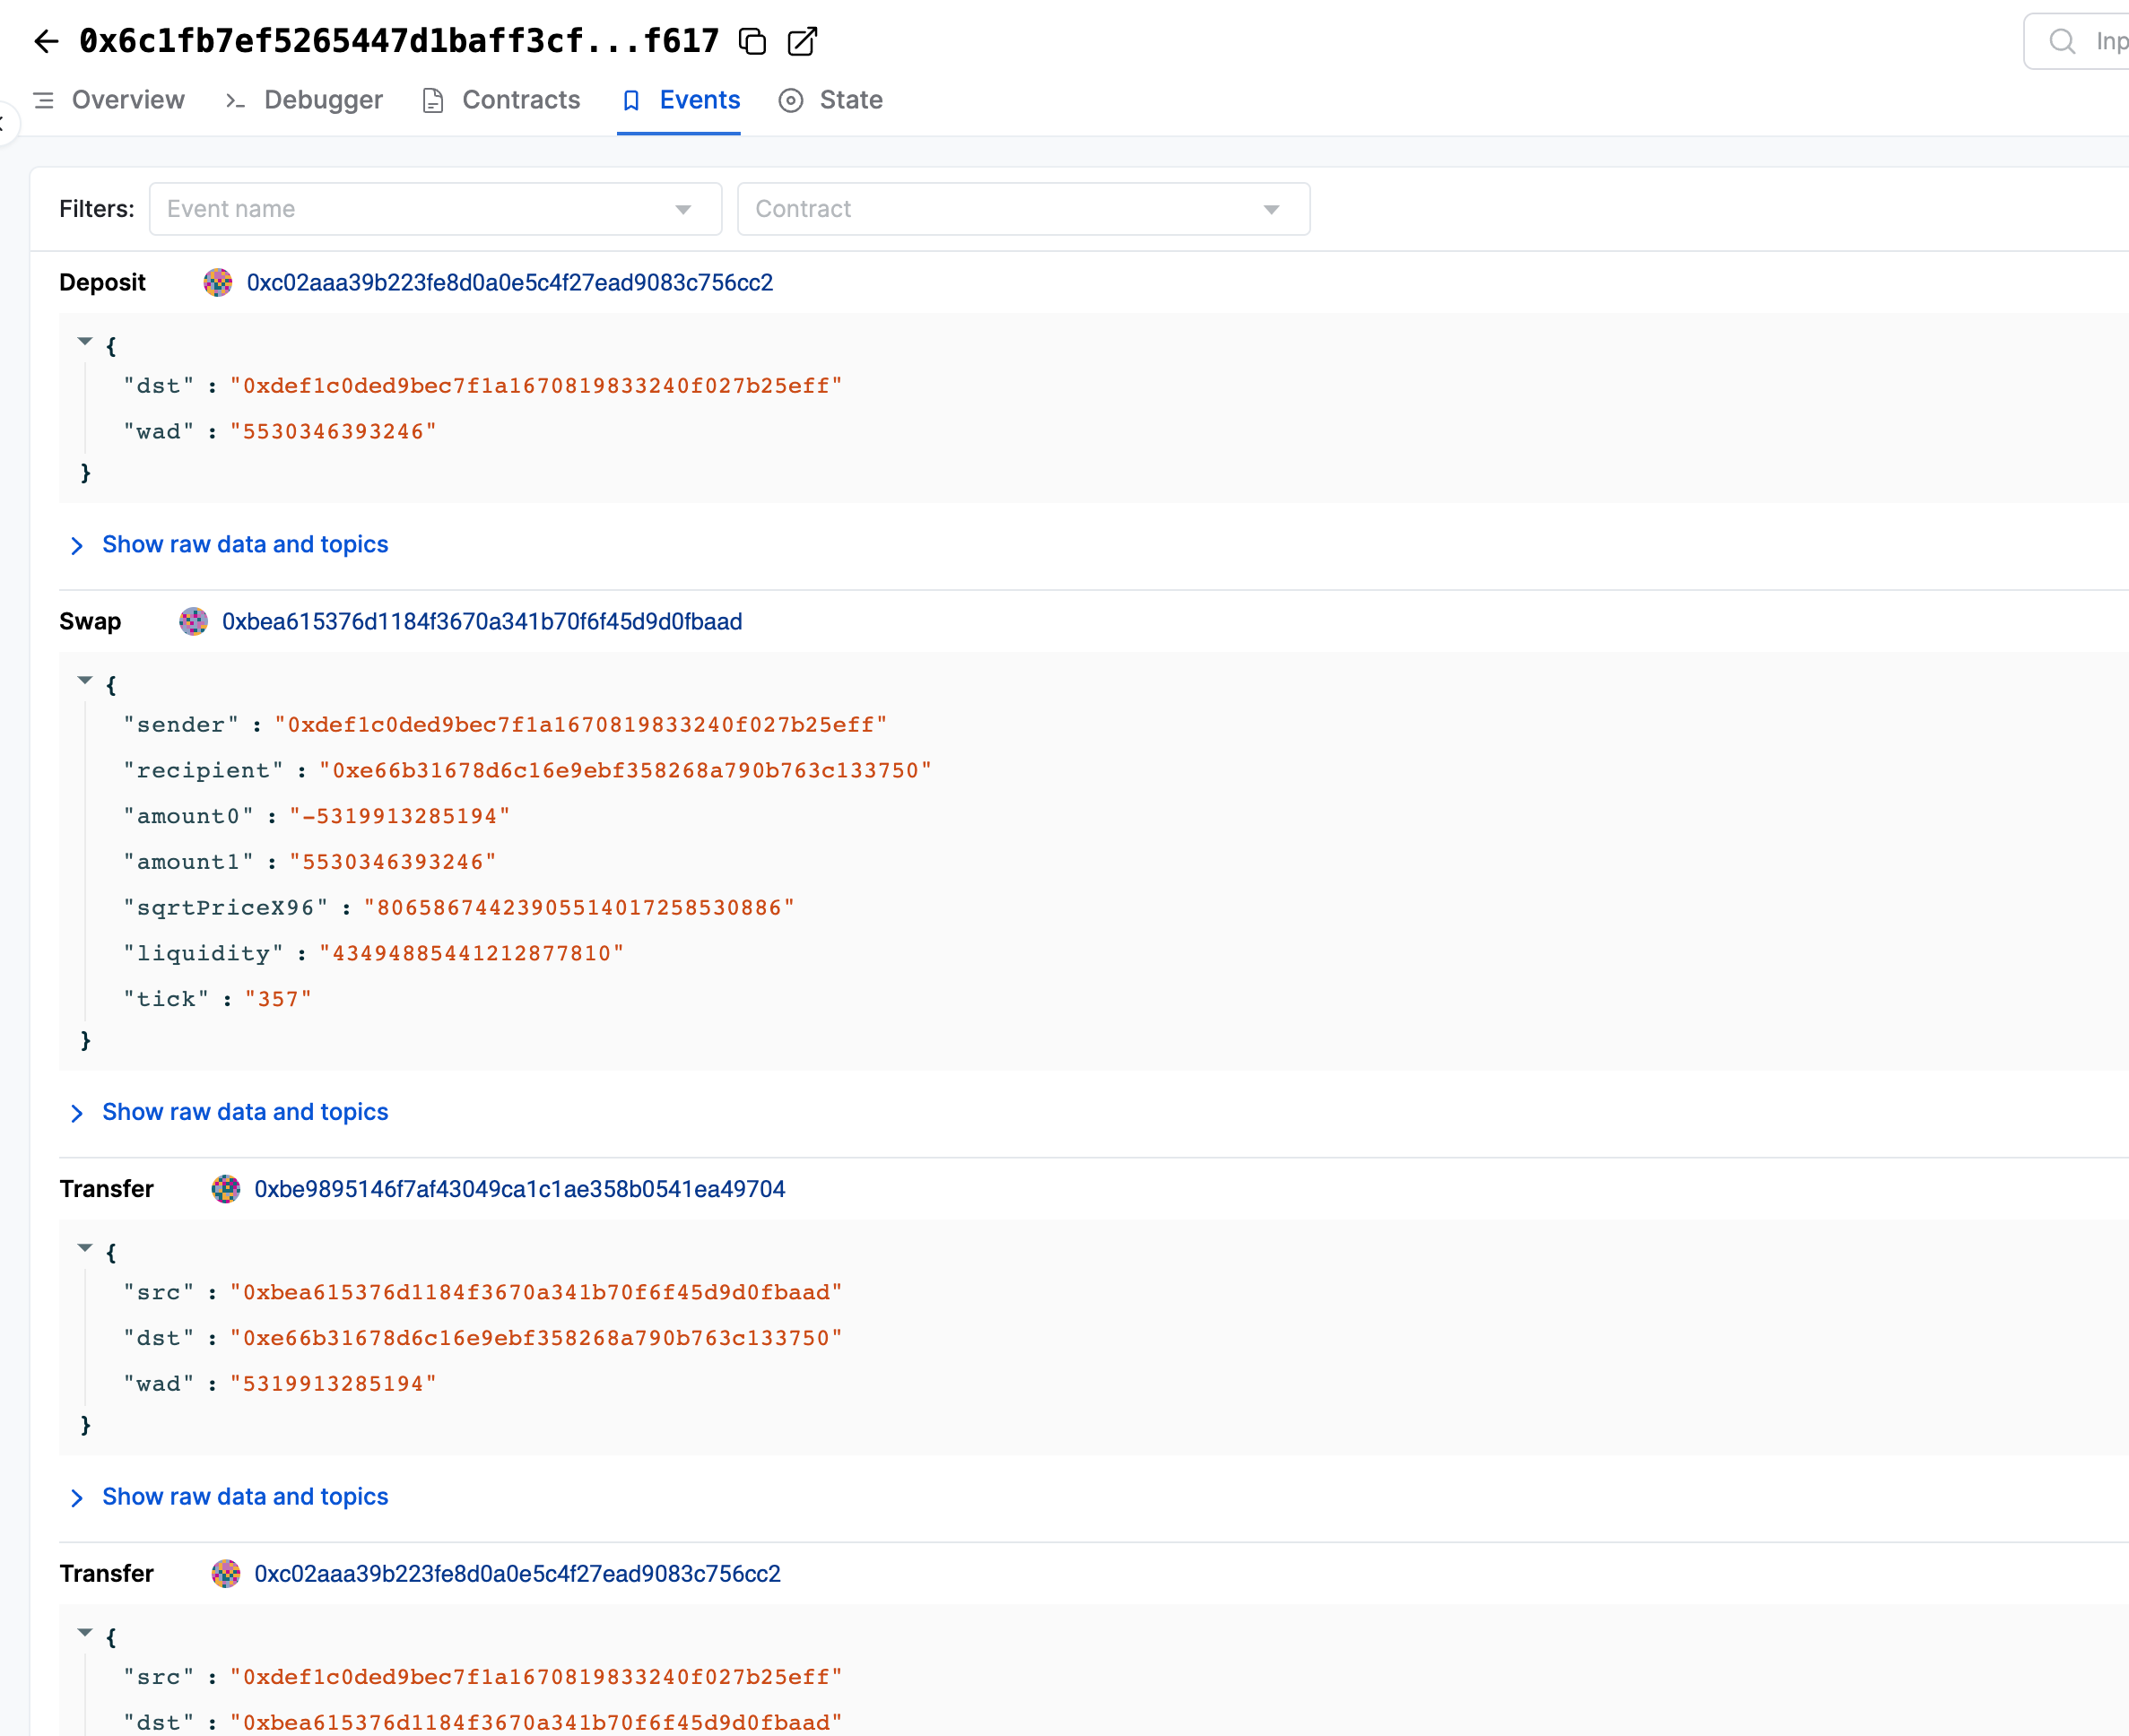
Events
Events are decoded where ABIs are available, and are otherwise displayed according to best effort on the Events tab.
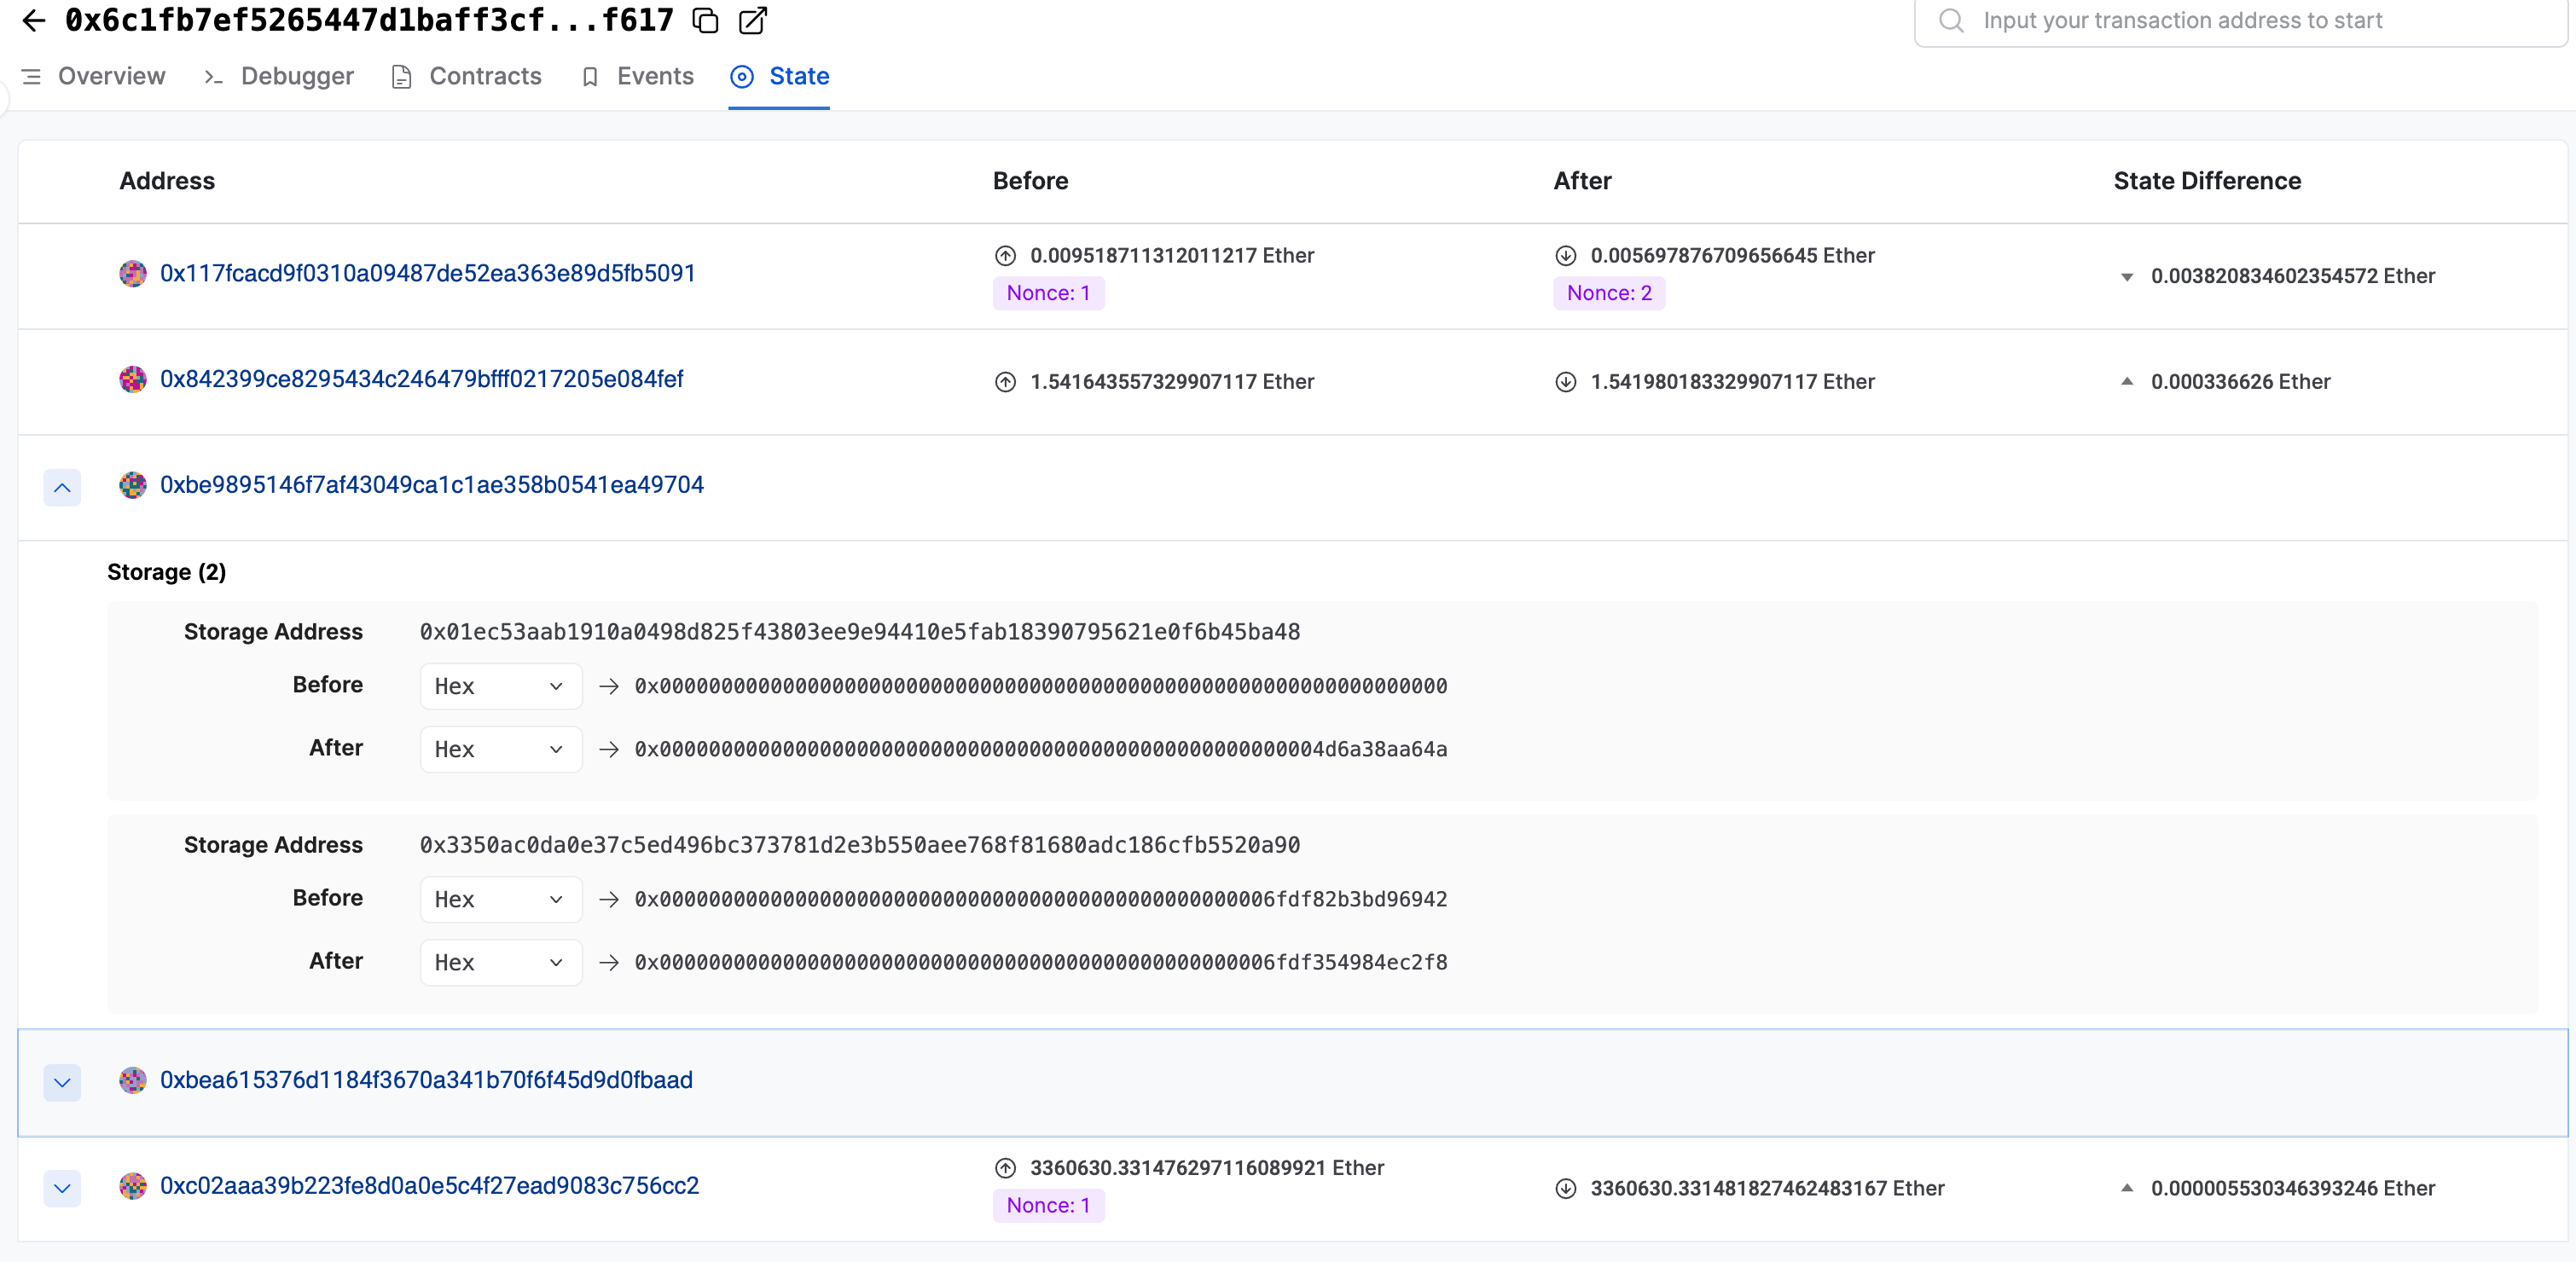
State Diff
When a transaction causes state changes, Sentio lists them on the State tab.
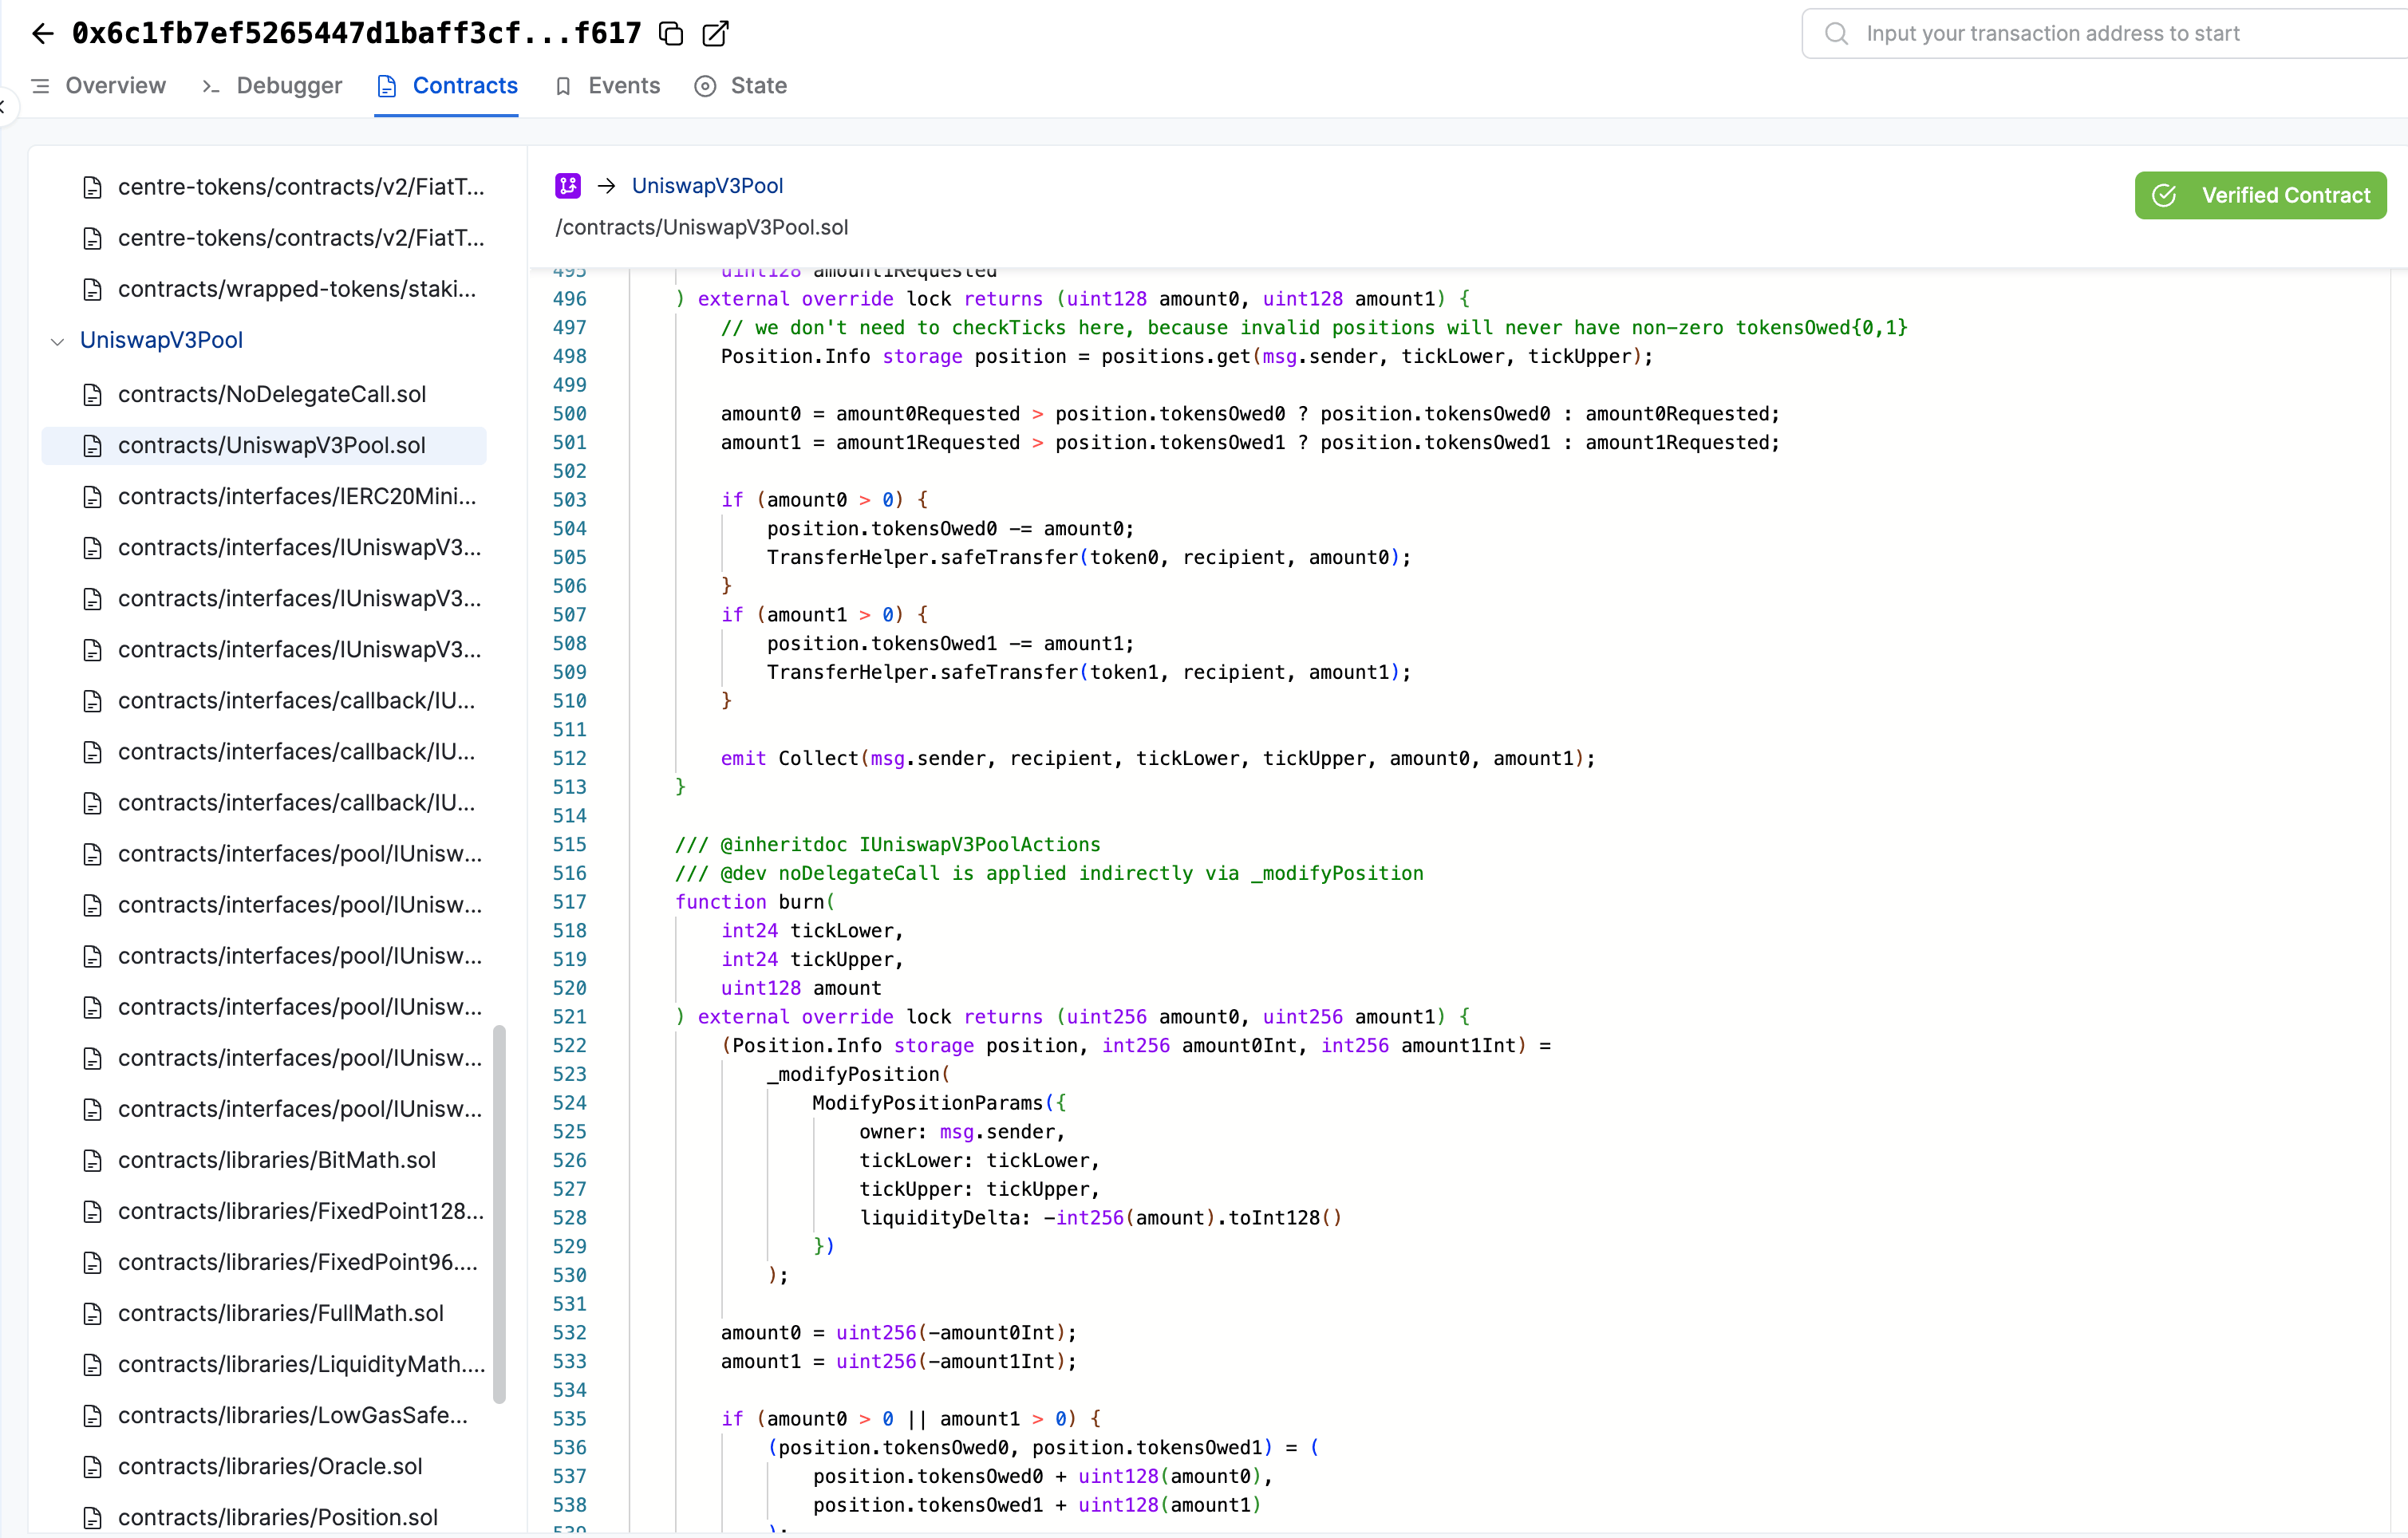
Contract Code Explorer
Sentio provides a code explorer for all the related code on the Contracts tab.
Trace the Money
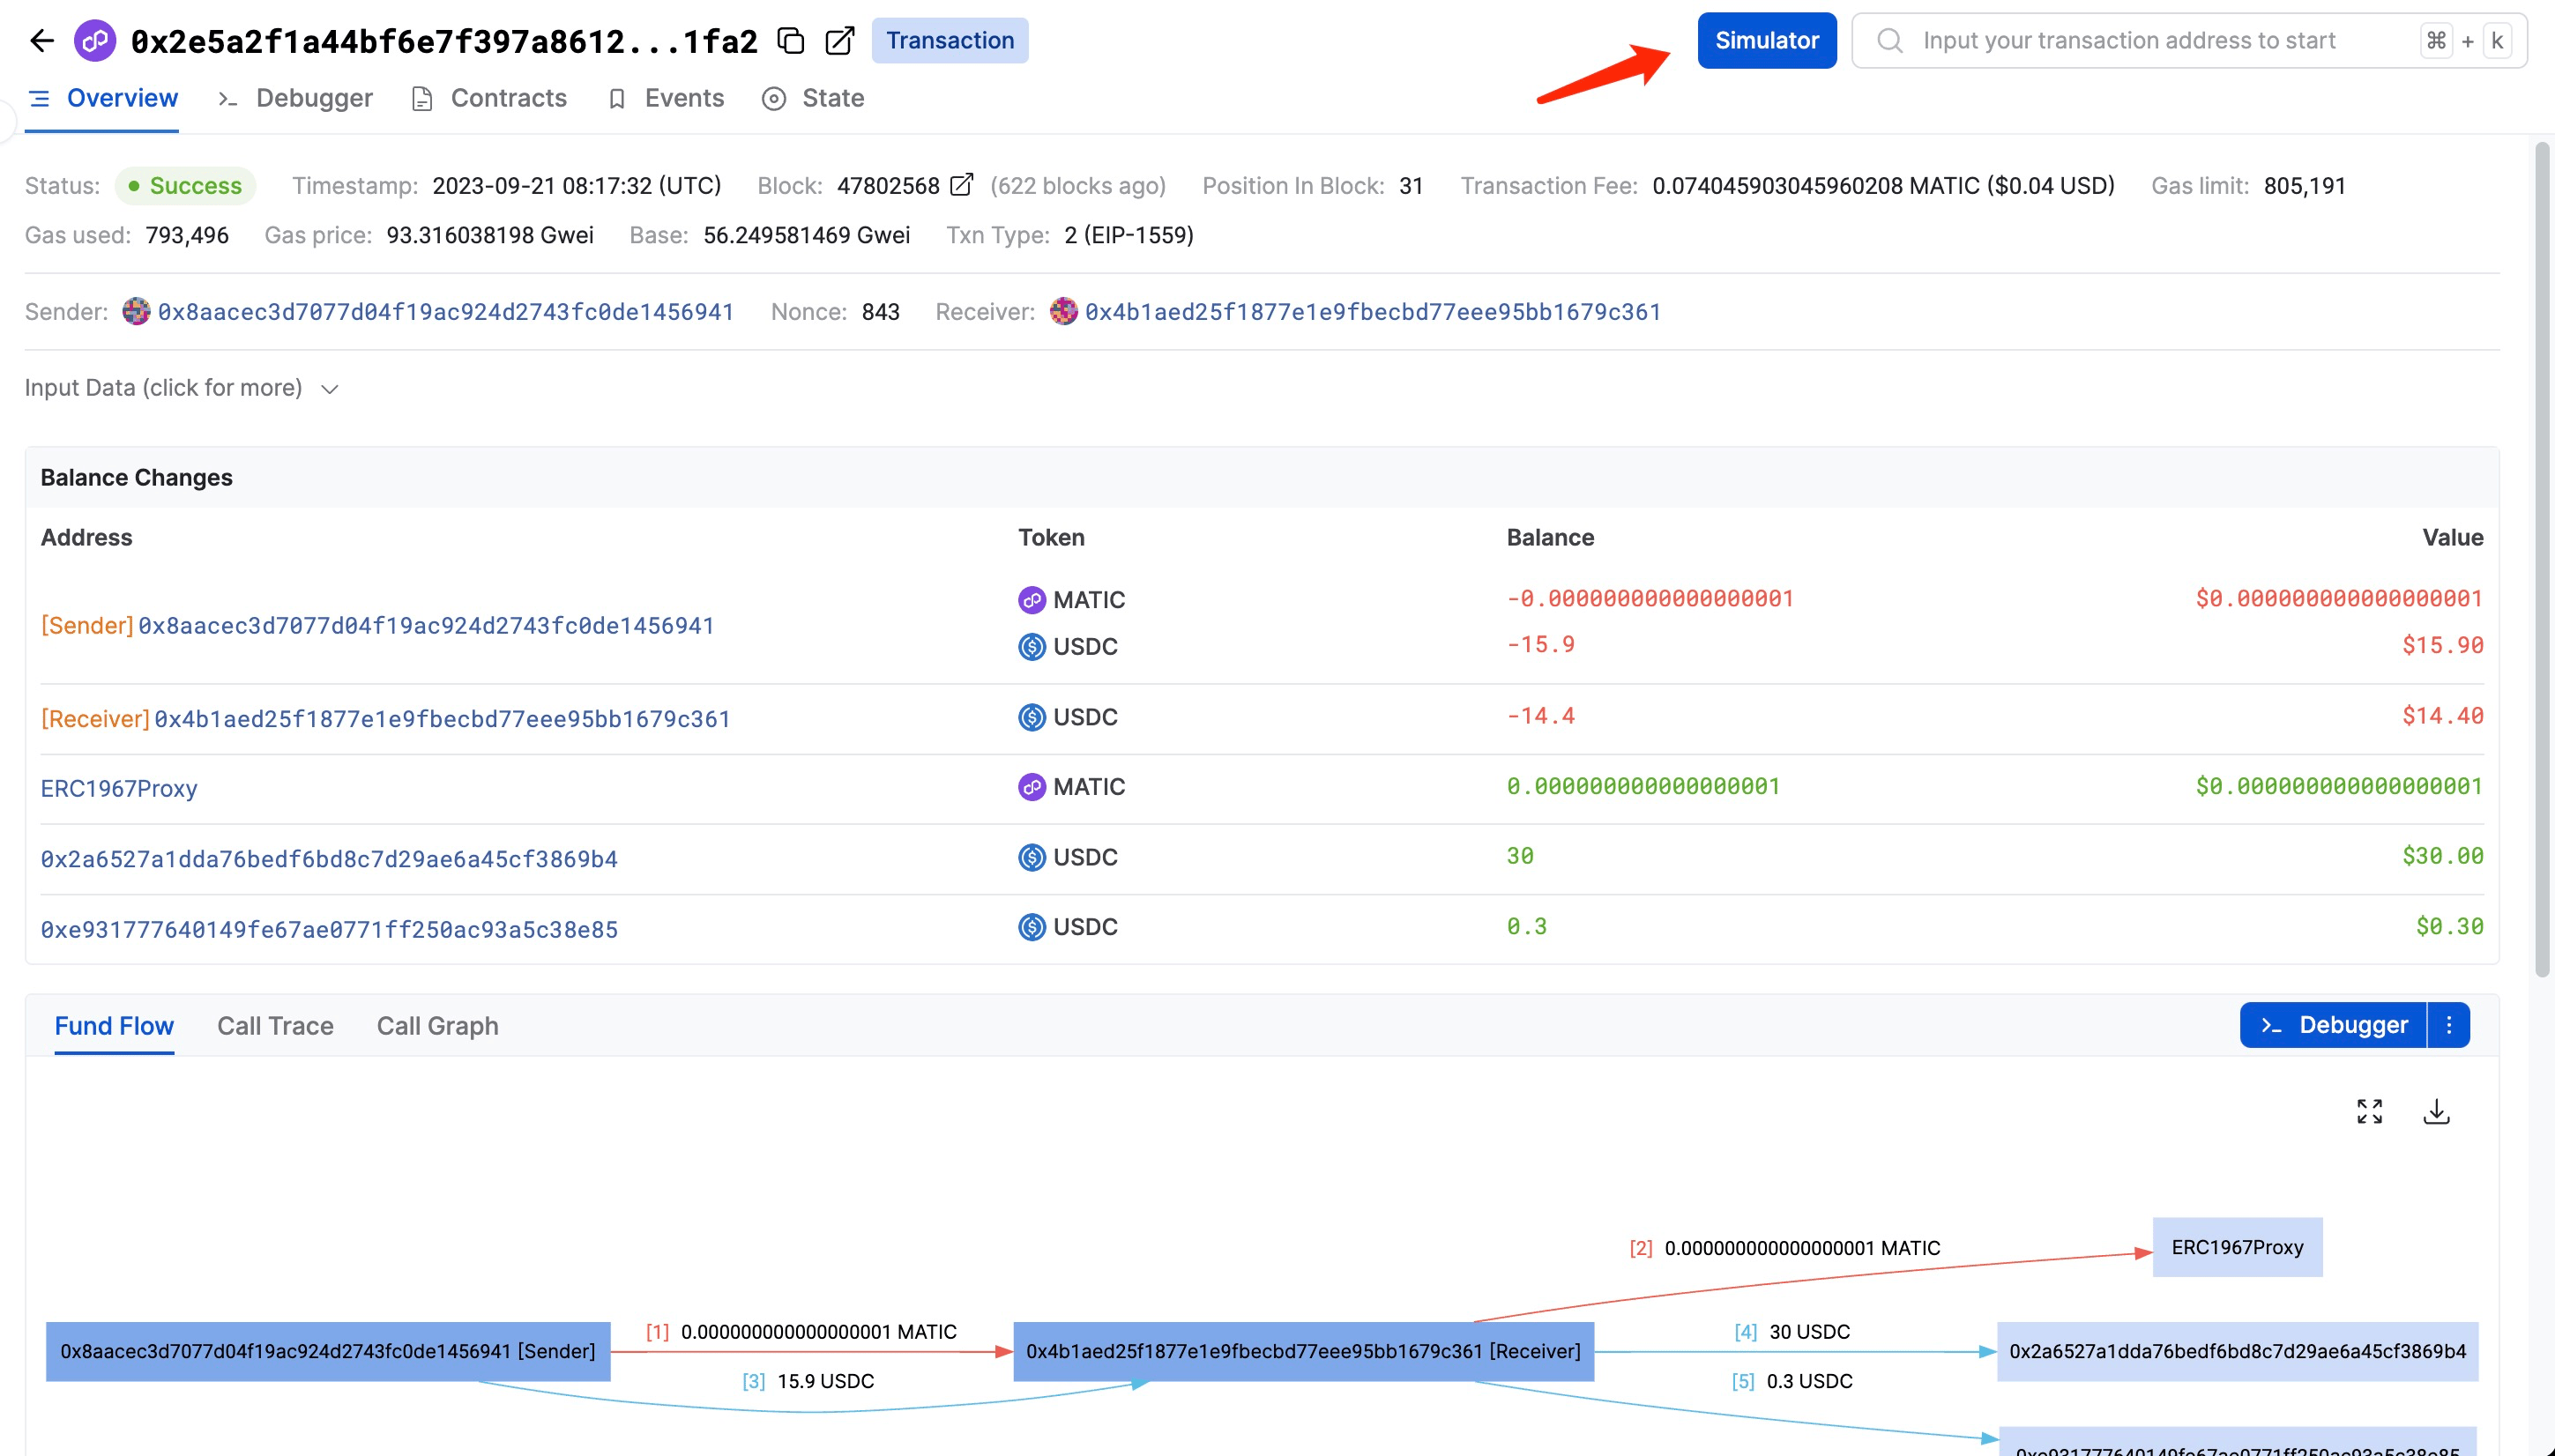
The best way to understand a transaction is to trace the money. Sentio provides both Balance Change and Fund Flow analysis tools.
Balance Change
While a transaction is executing, multiple contracts may have their balances updated. Sentio displays the balance changes that occur during a transaction.
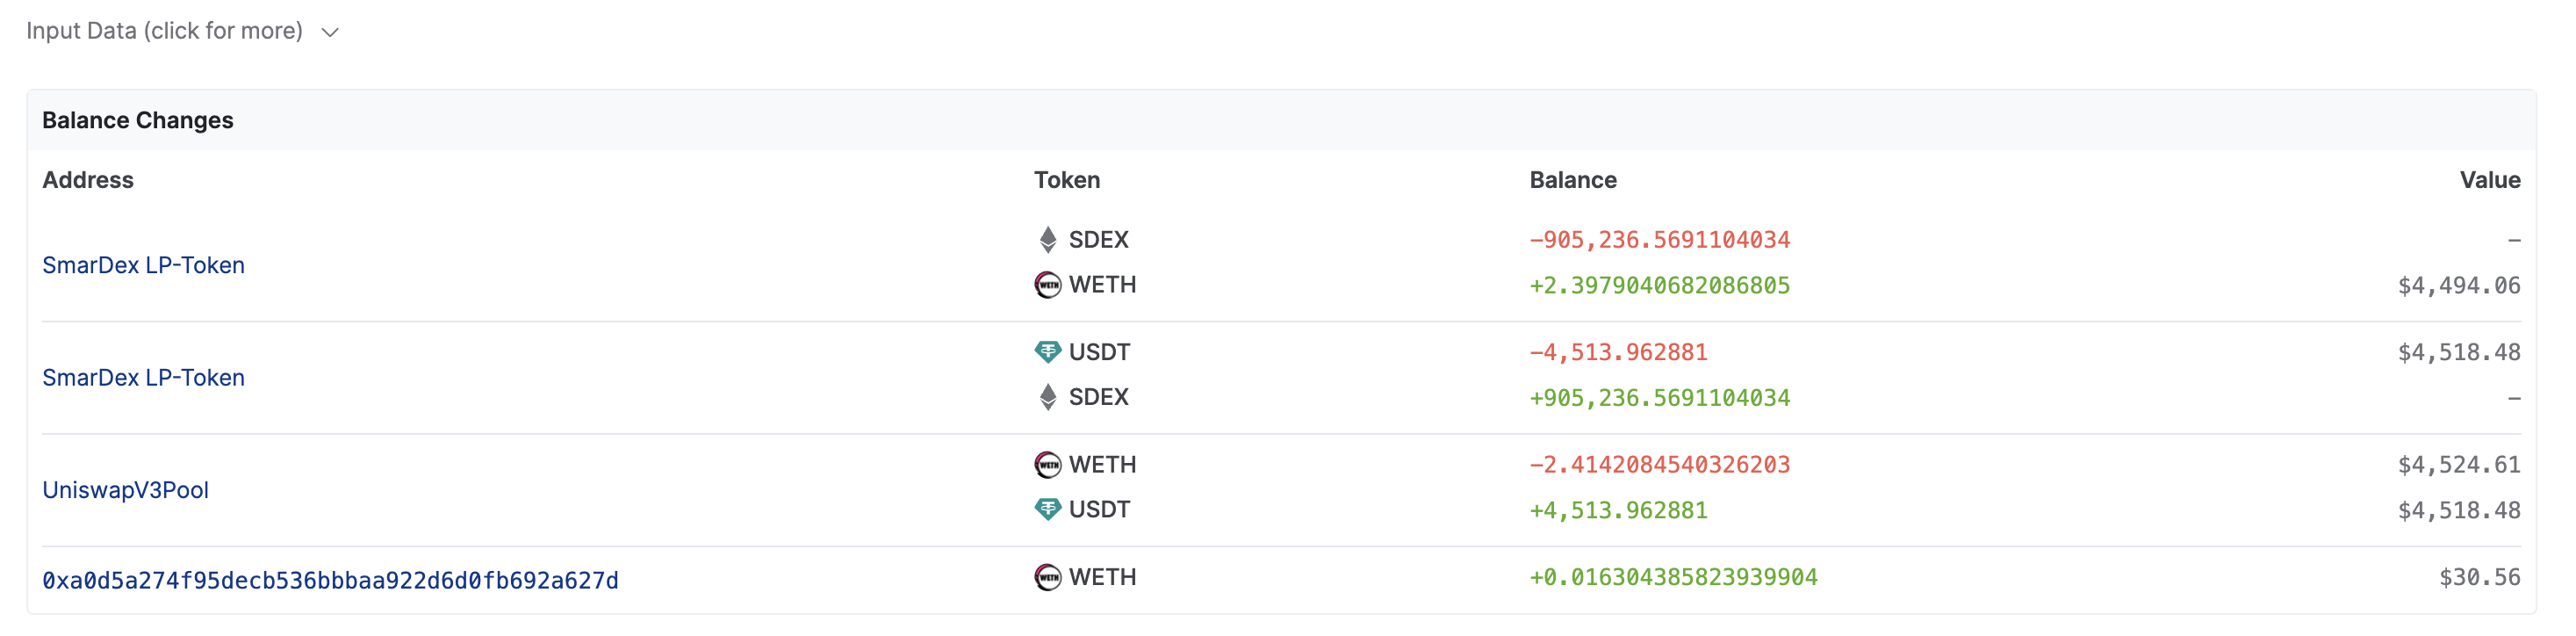
For example, in this MEV arbitrage transaction above, each party involved has a balance of different assets increasing and decreasing, except one address (0xa0d...) which has only an increasing asset, indicating that it made the arbitrage profit.
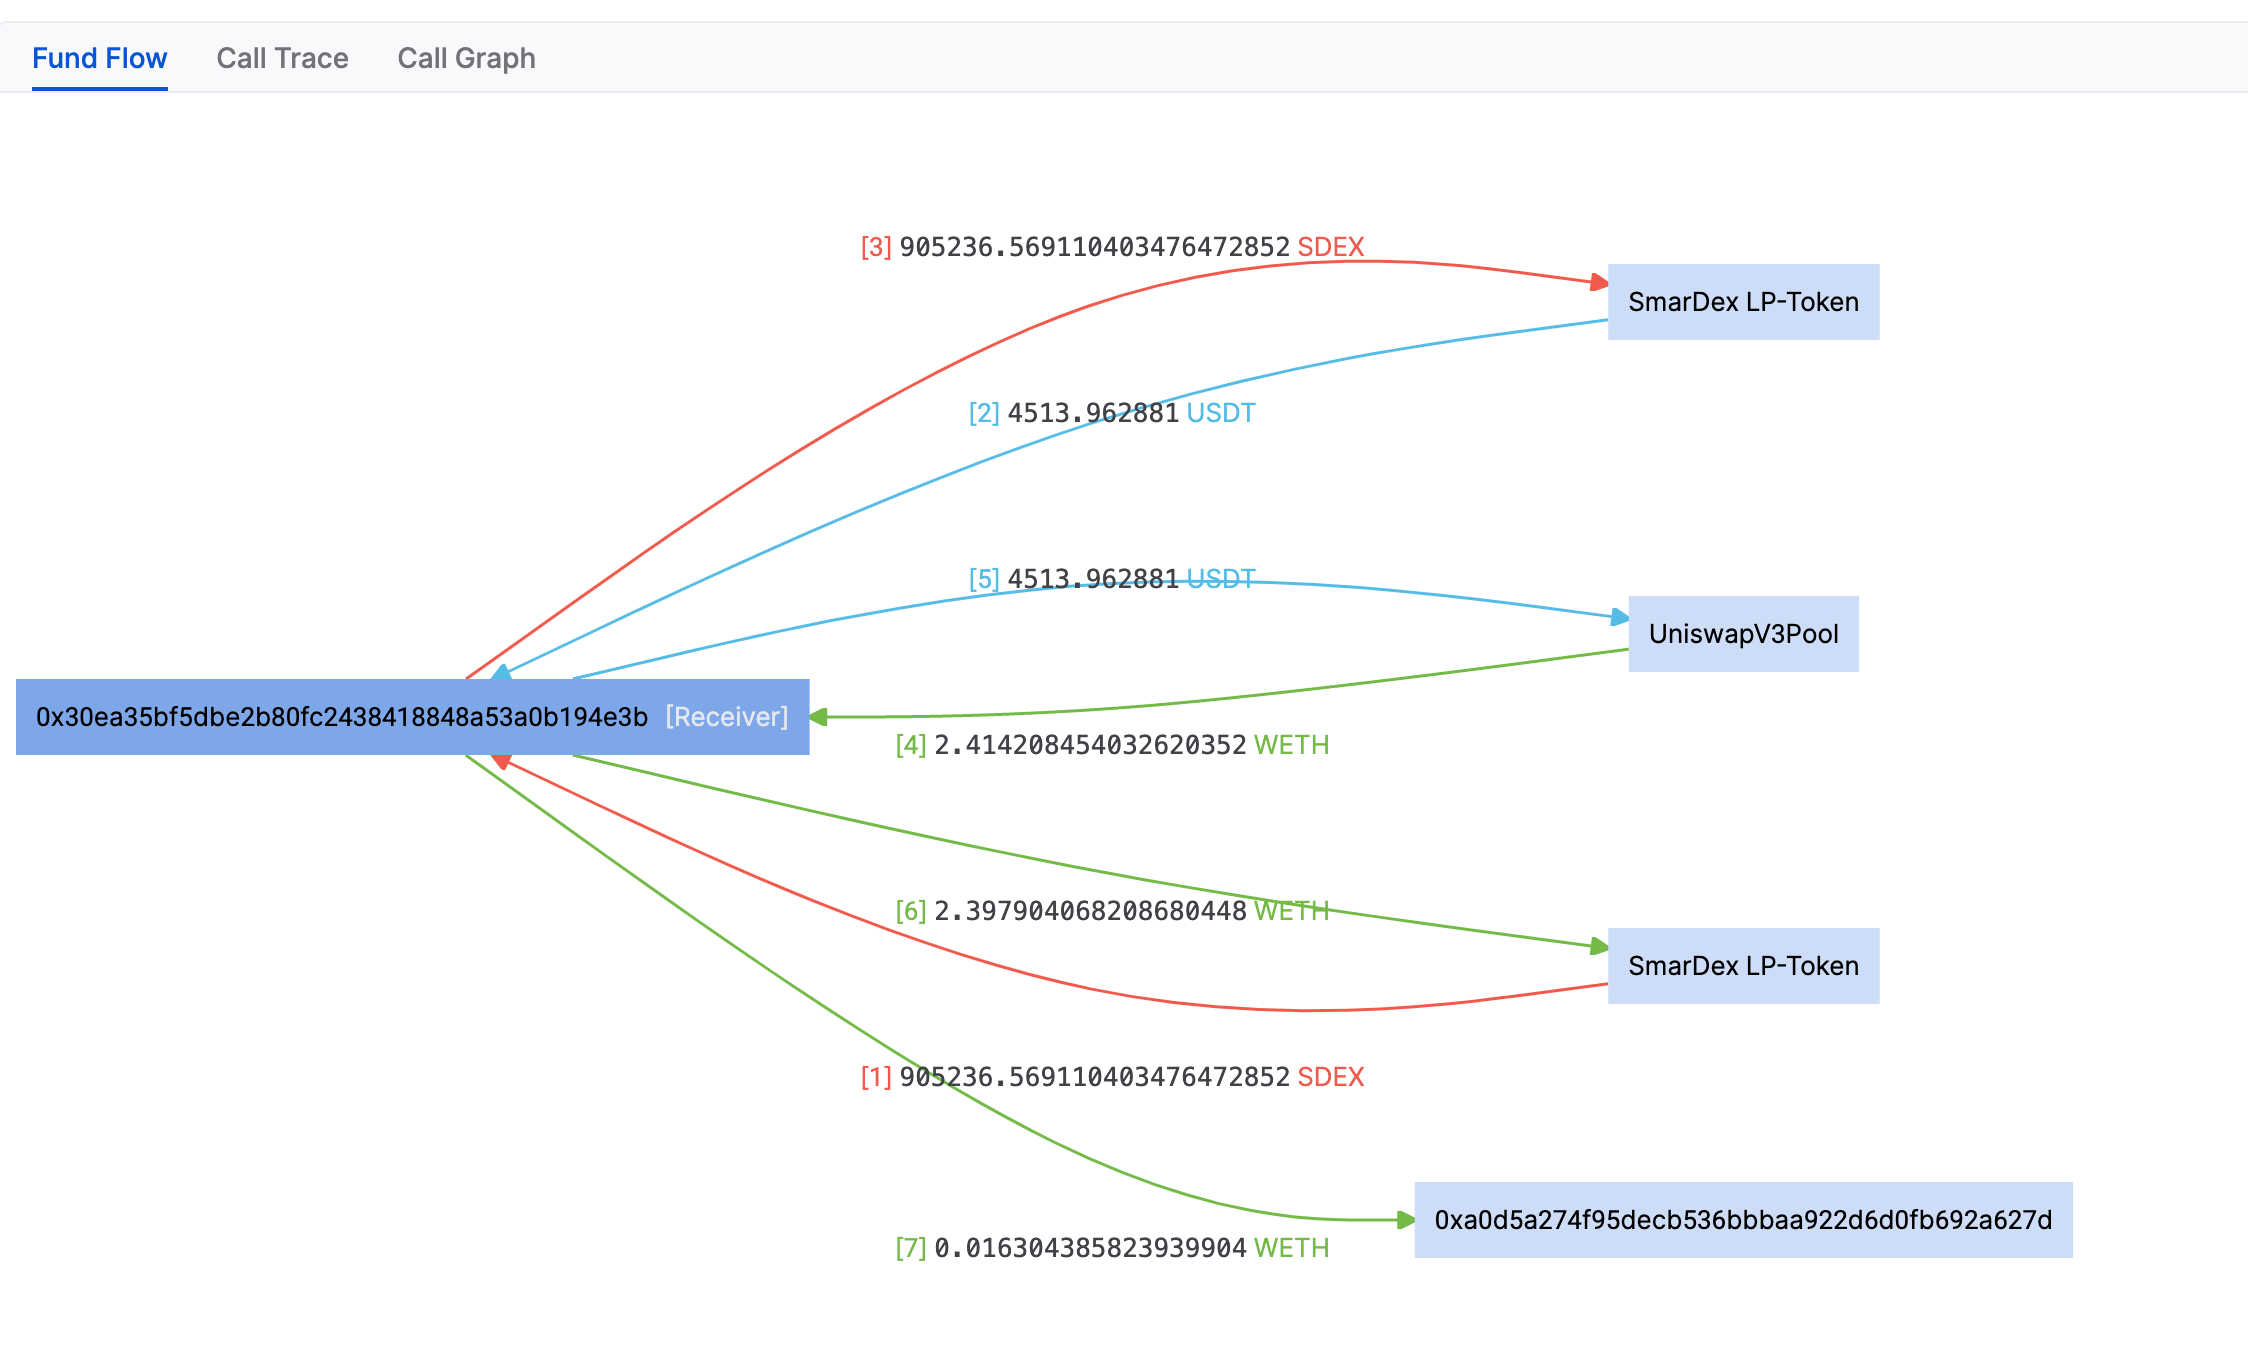
Fund Flows
Sentio provides detailed and ordered fund flows. In the following example we visualize the process of how an arbitrageur made a profit by utilizing several trading venues.
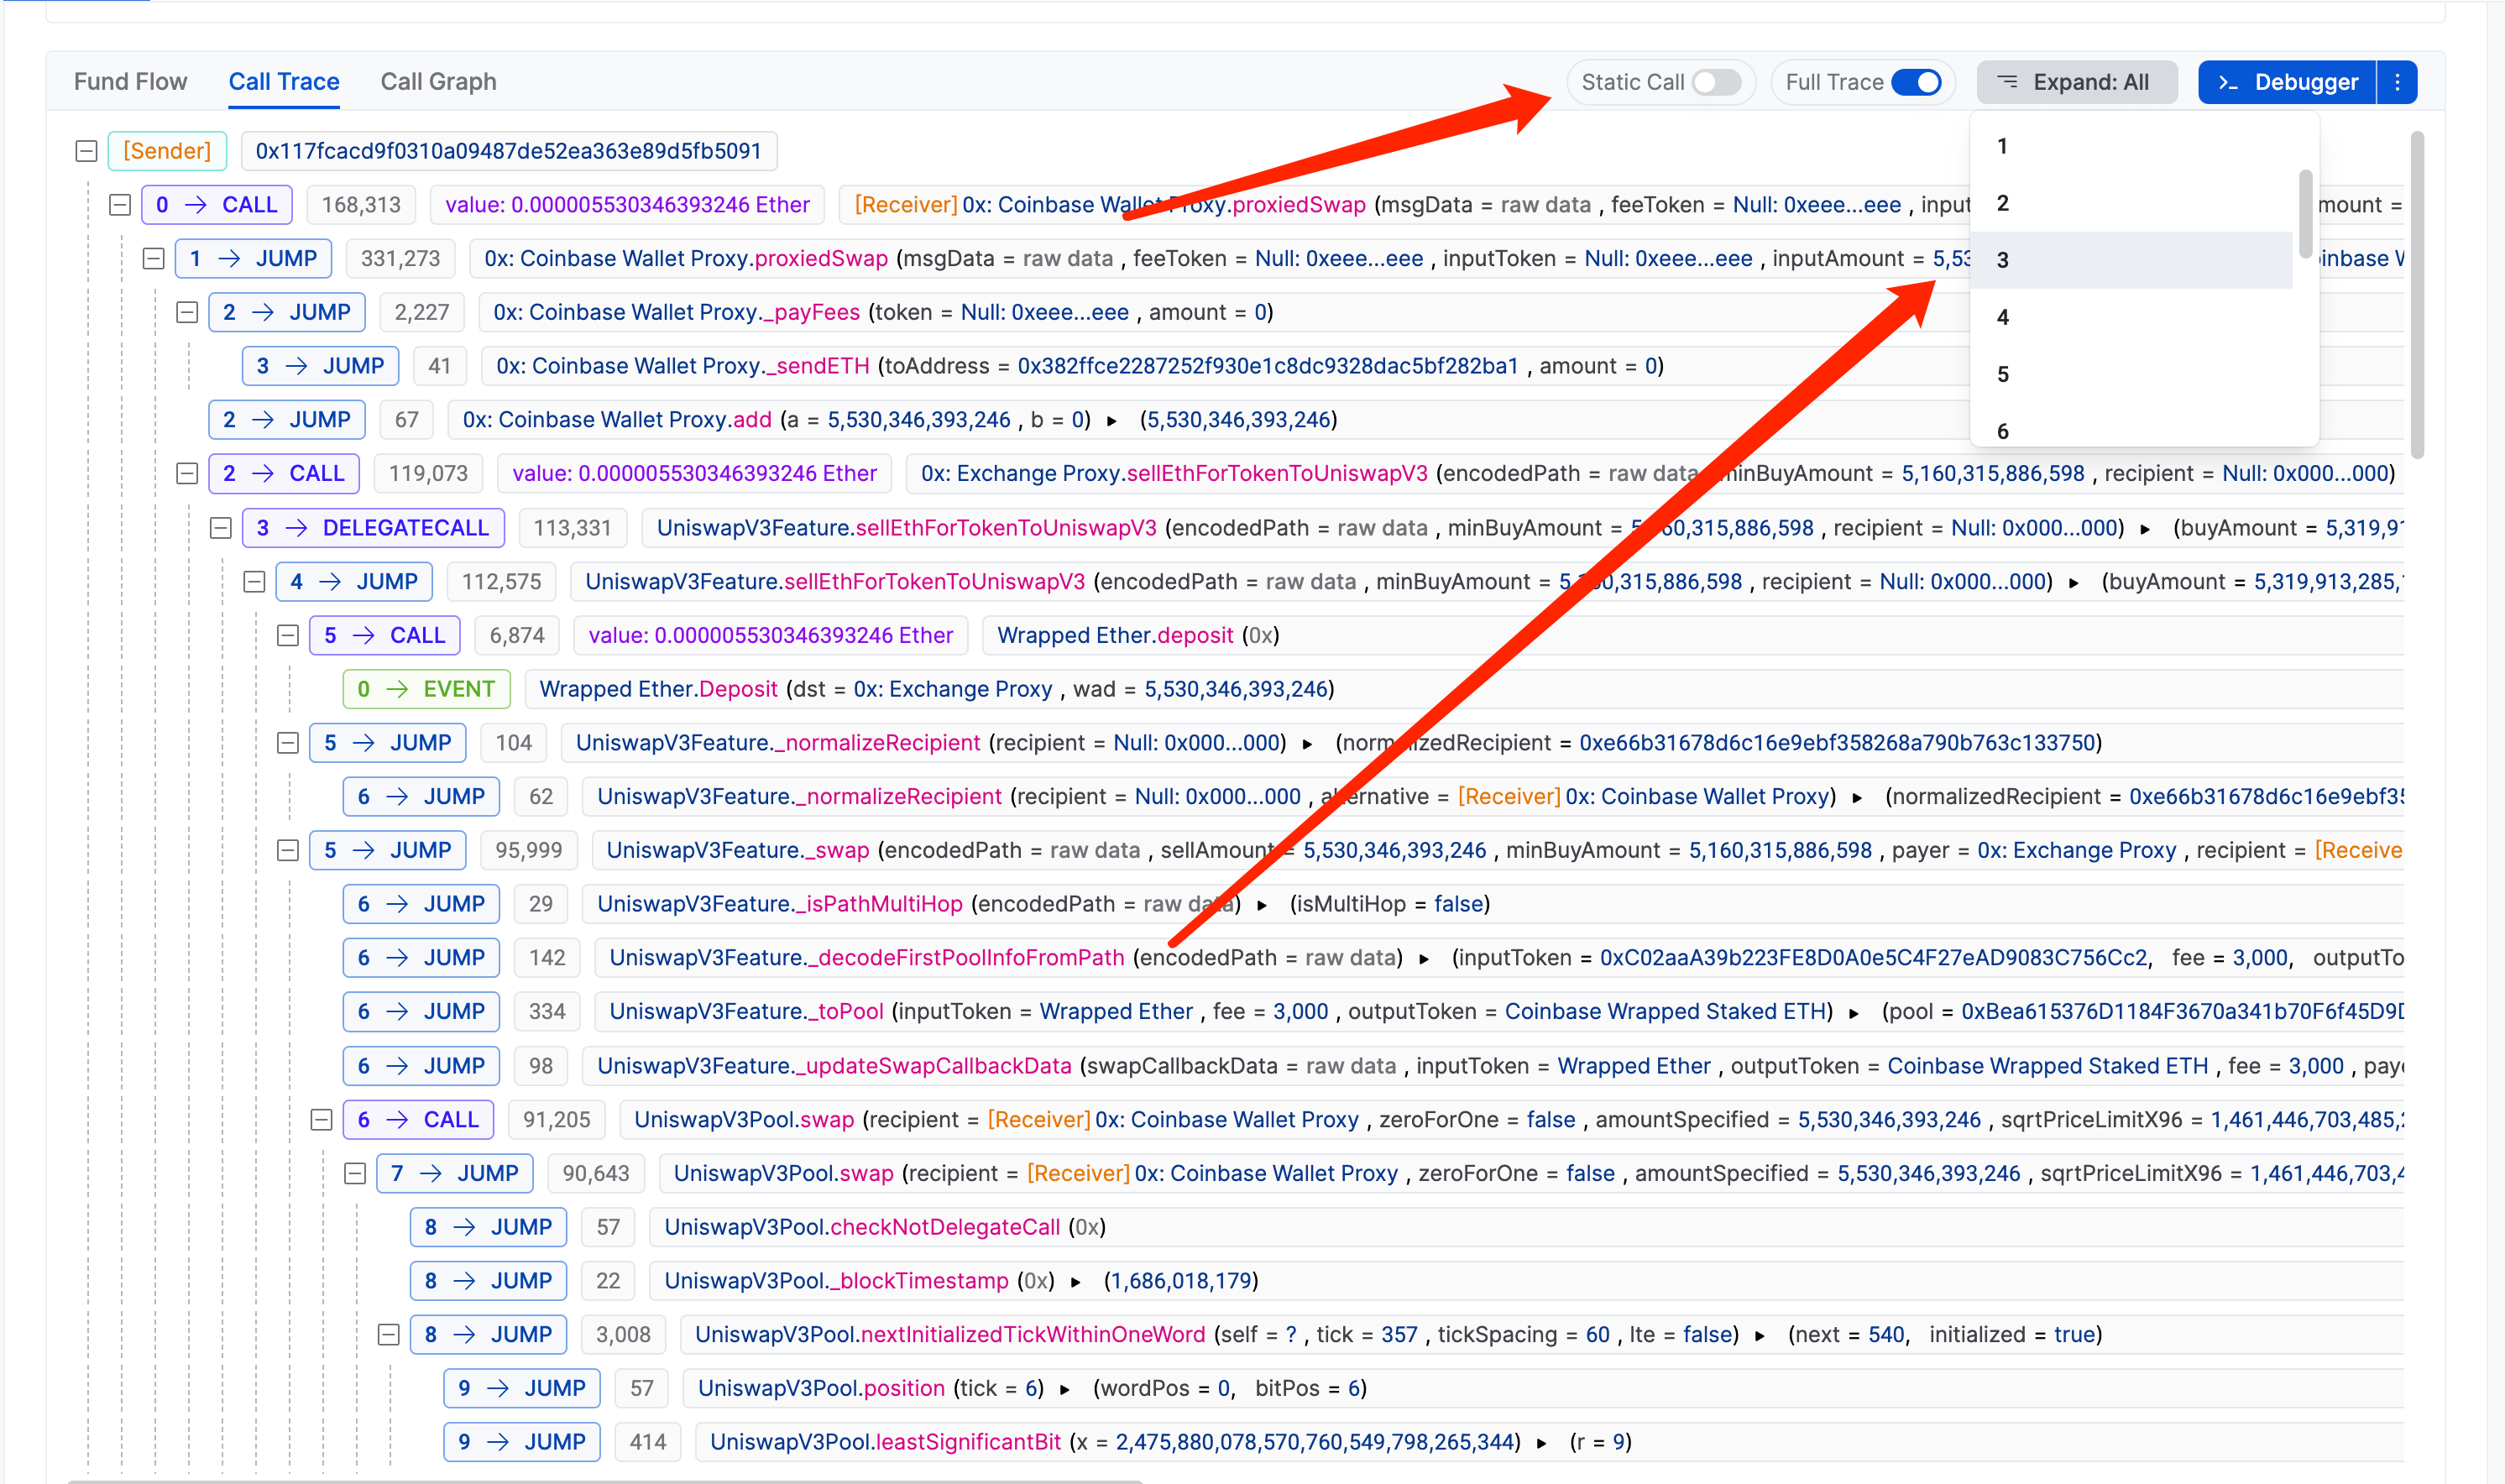
Trace and Call
Sentio provides trace view of transactions.
Trace modes and options
Trace mode: Full trace mode includes cross-contract calls (CALL) and in-contract calls (JUMP).
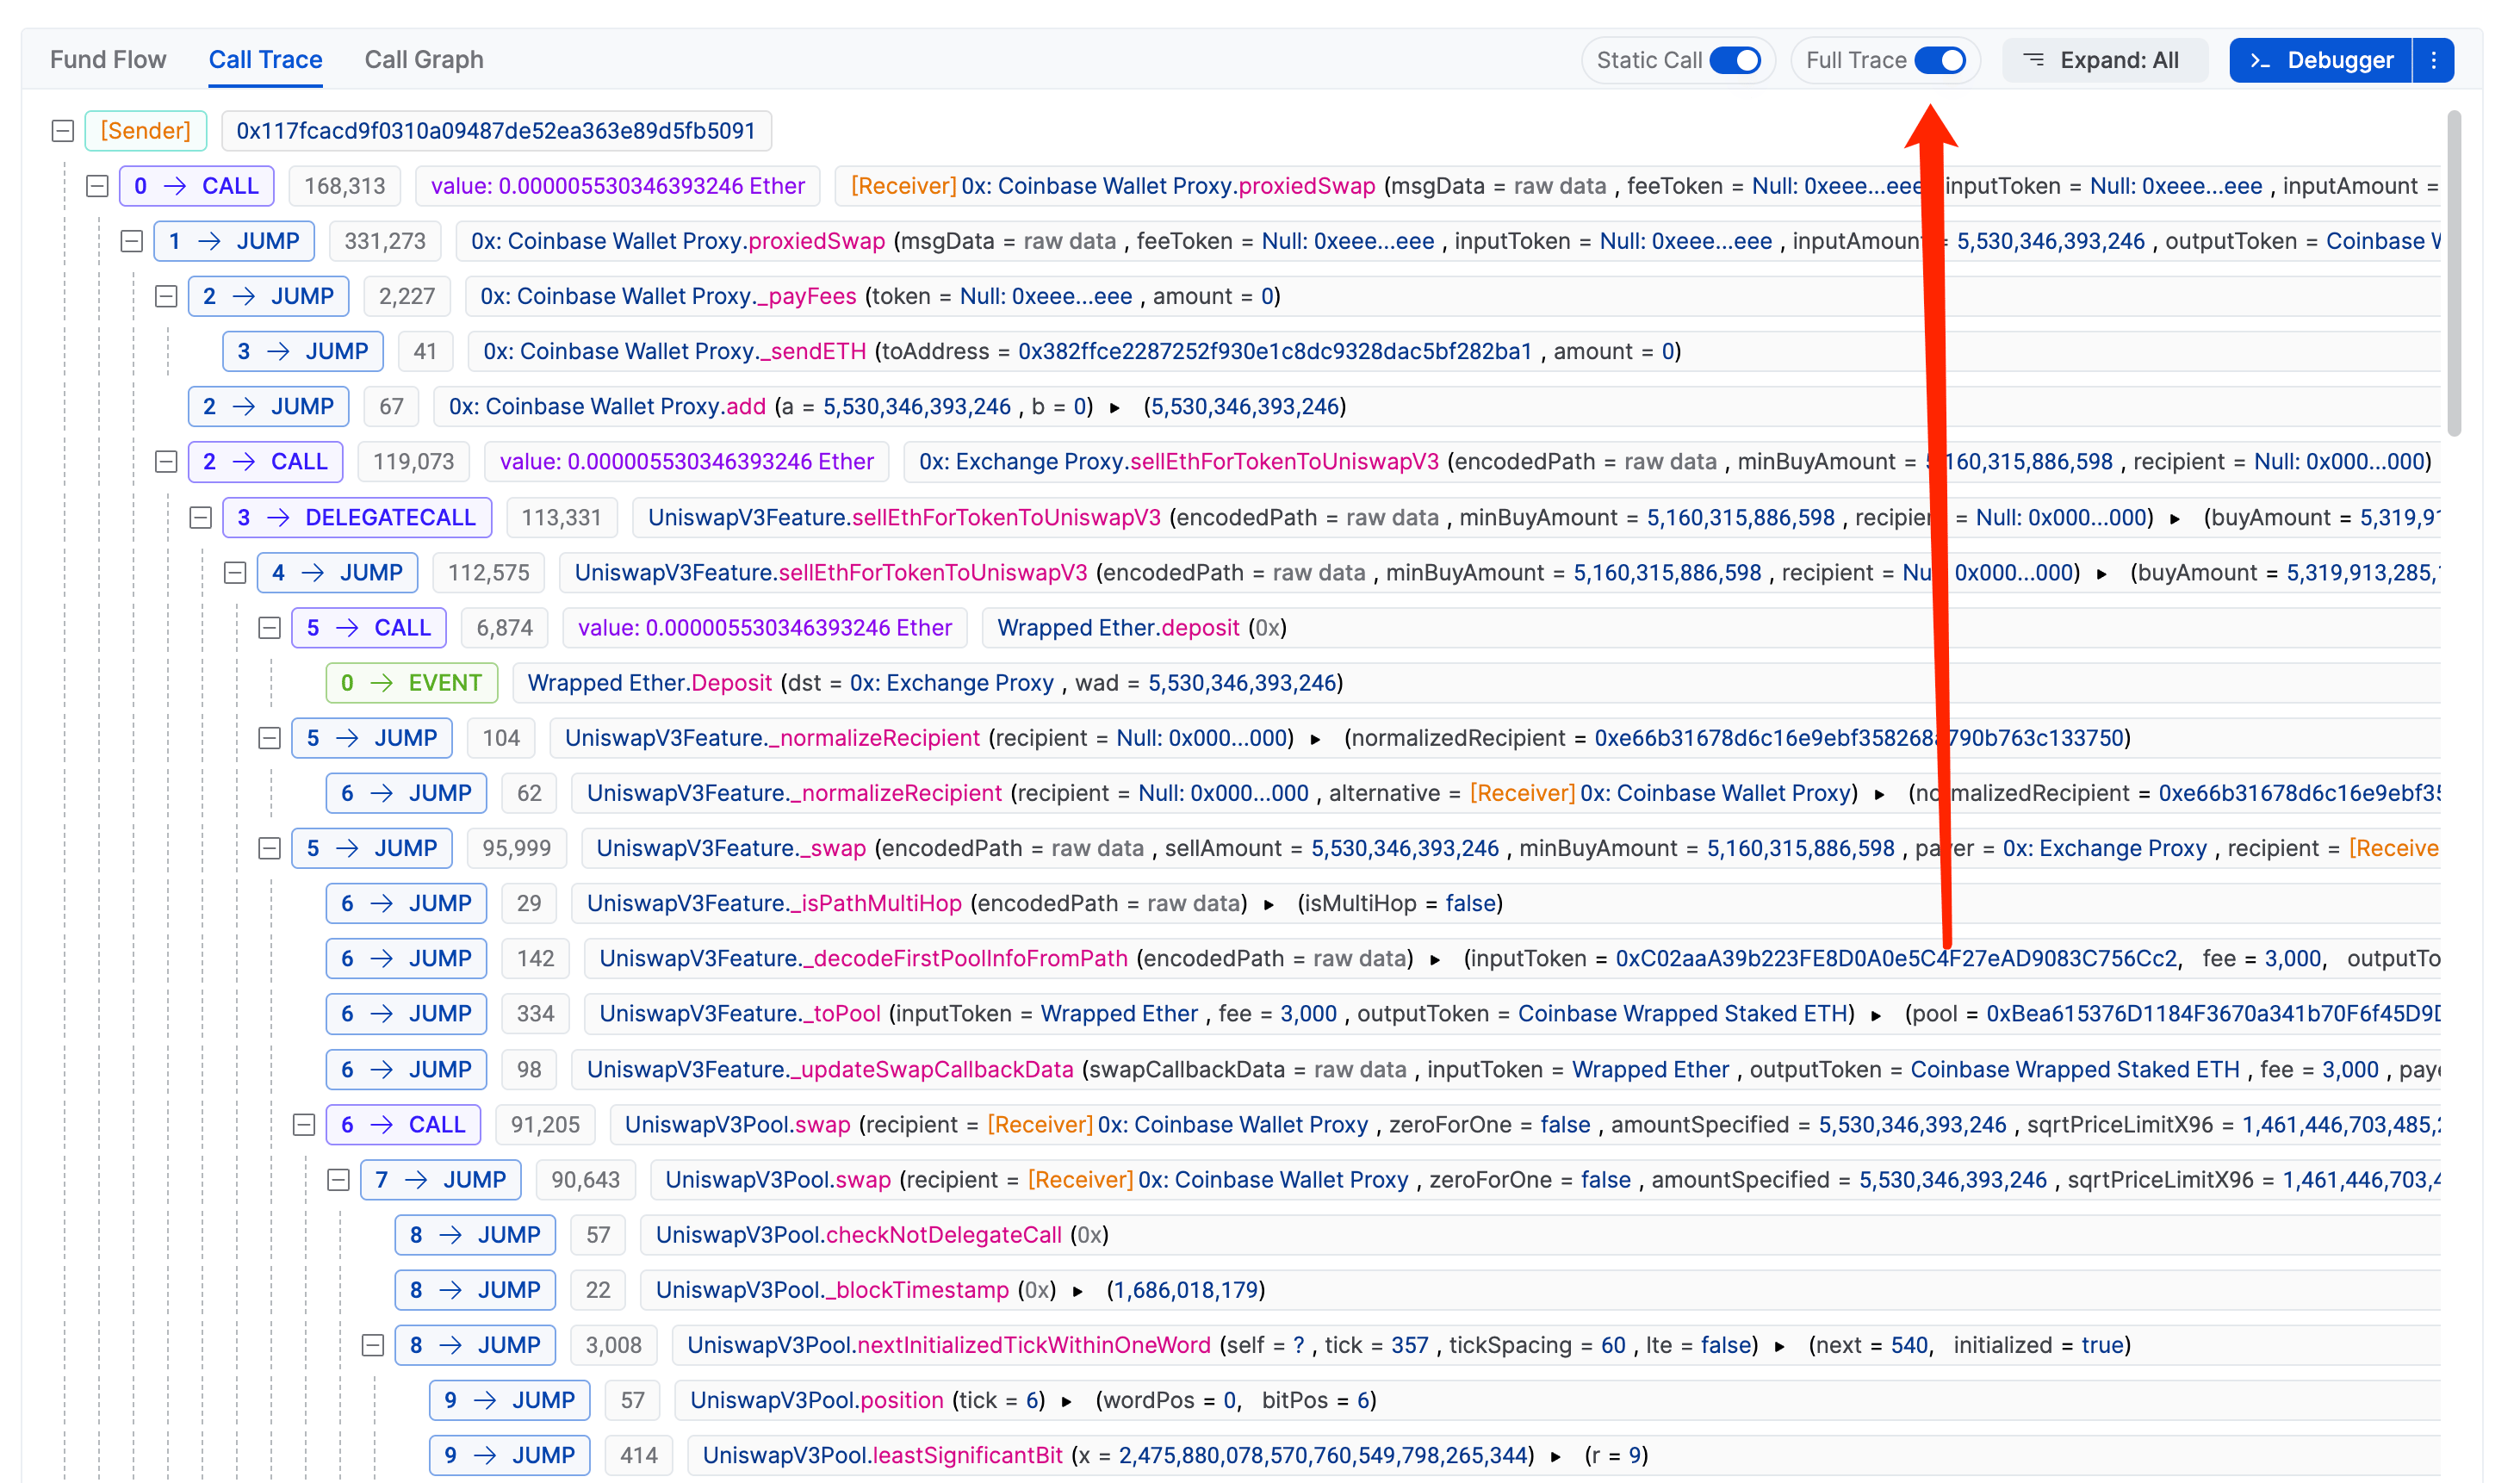
You can also hide in-contract calls (JUMP) by turning off Full trace.
Options: Users can hide static calls and select the level of trace displayed.
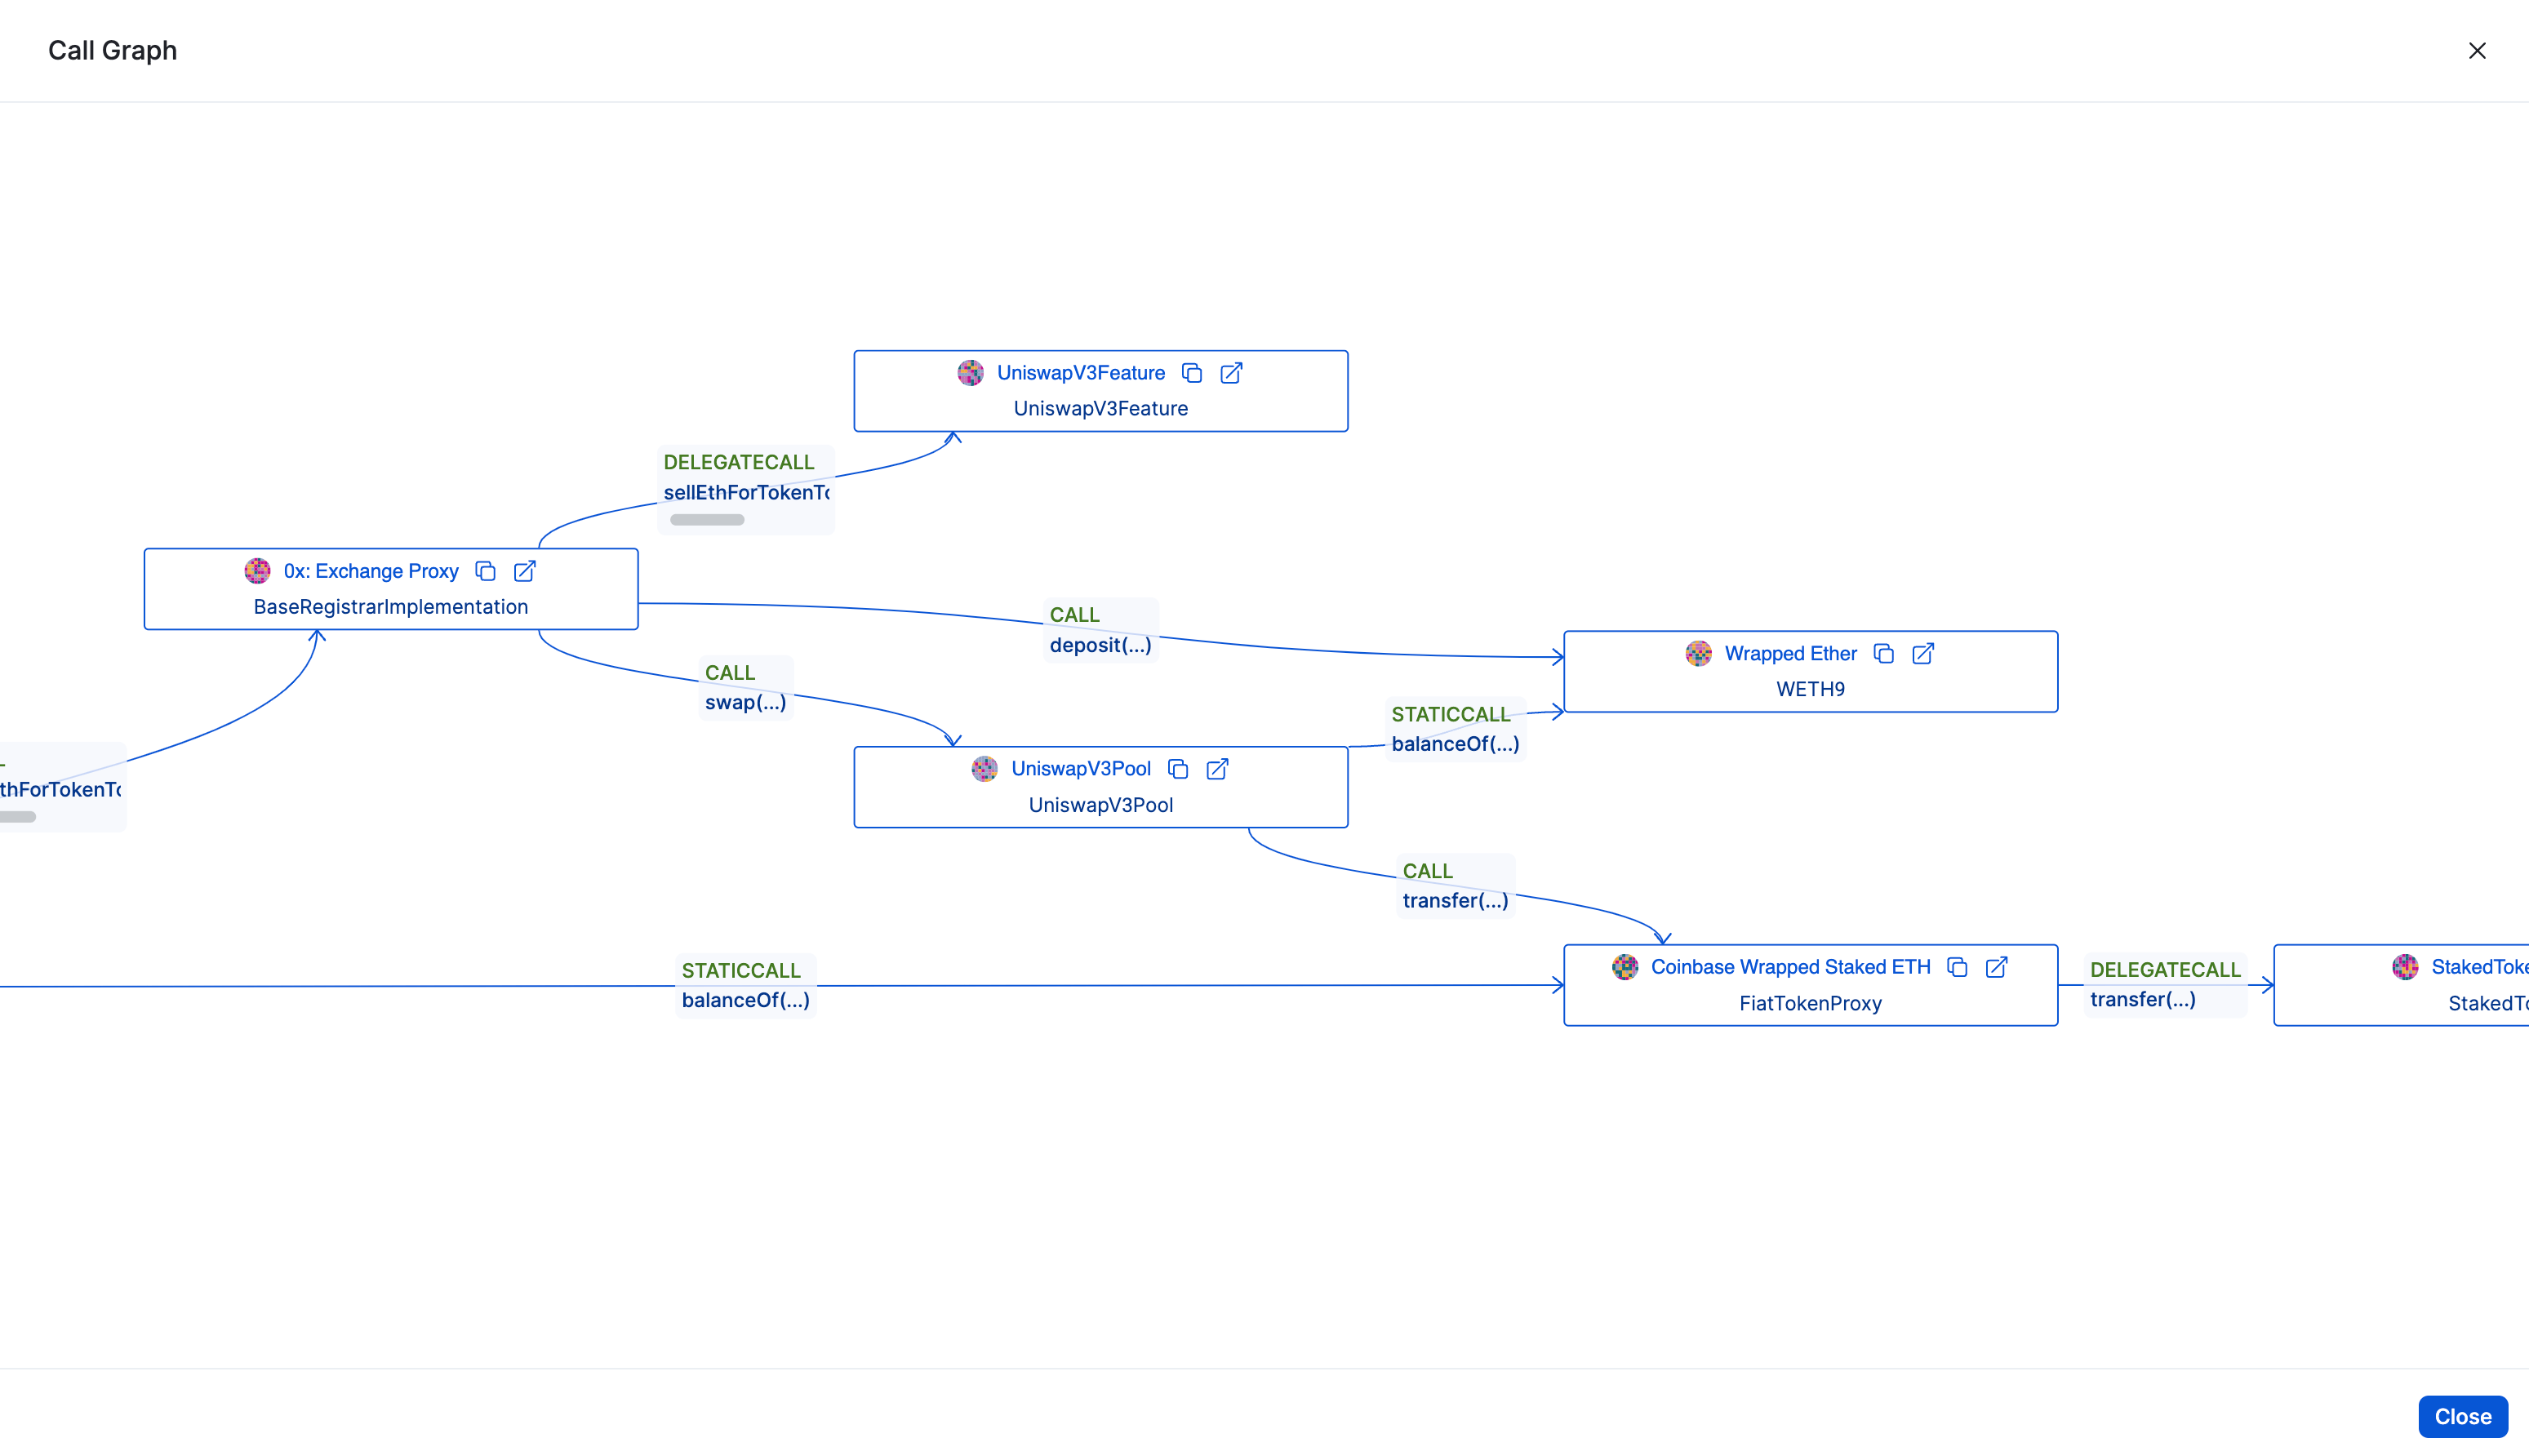
Call Graph: Sentio provides the call graph that shows the contract interactions within a transaction.
Debugging
To understand a transaction even further, developers can use the Debugger tab to visualize the execution line-by-line.
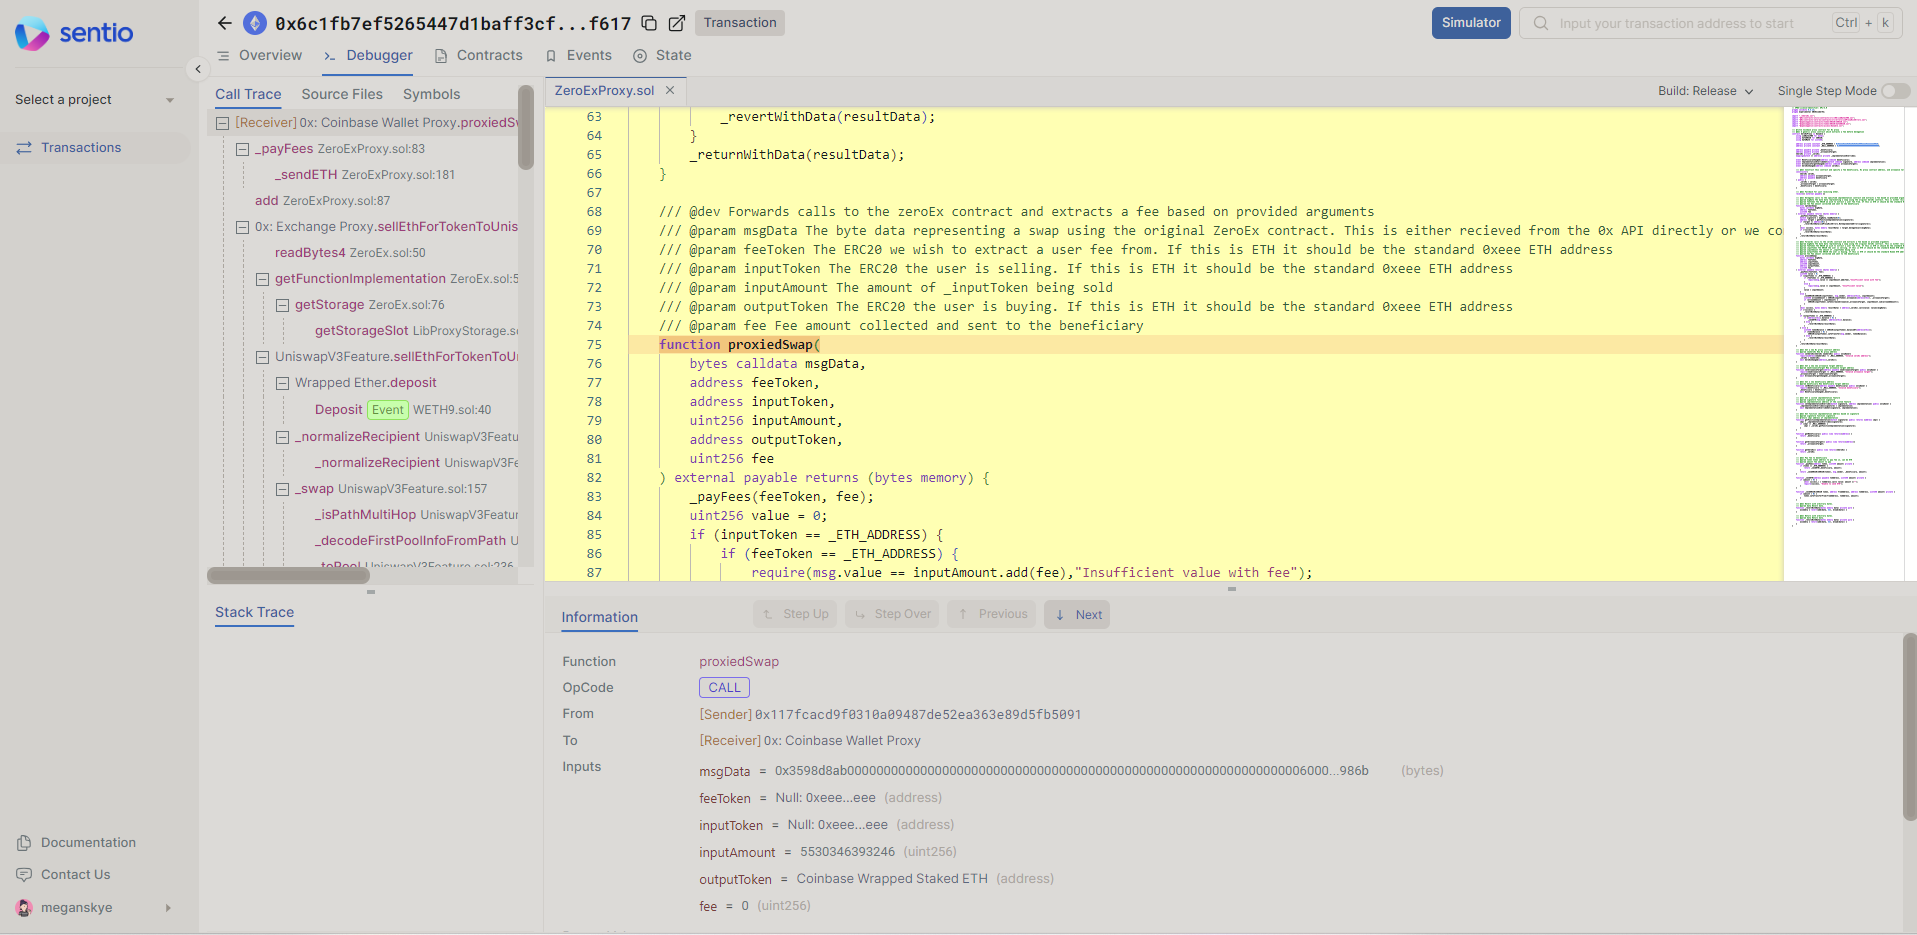
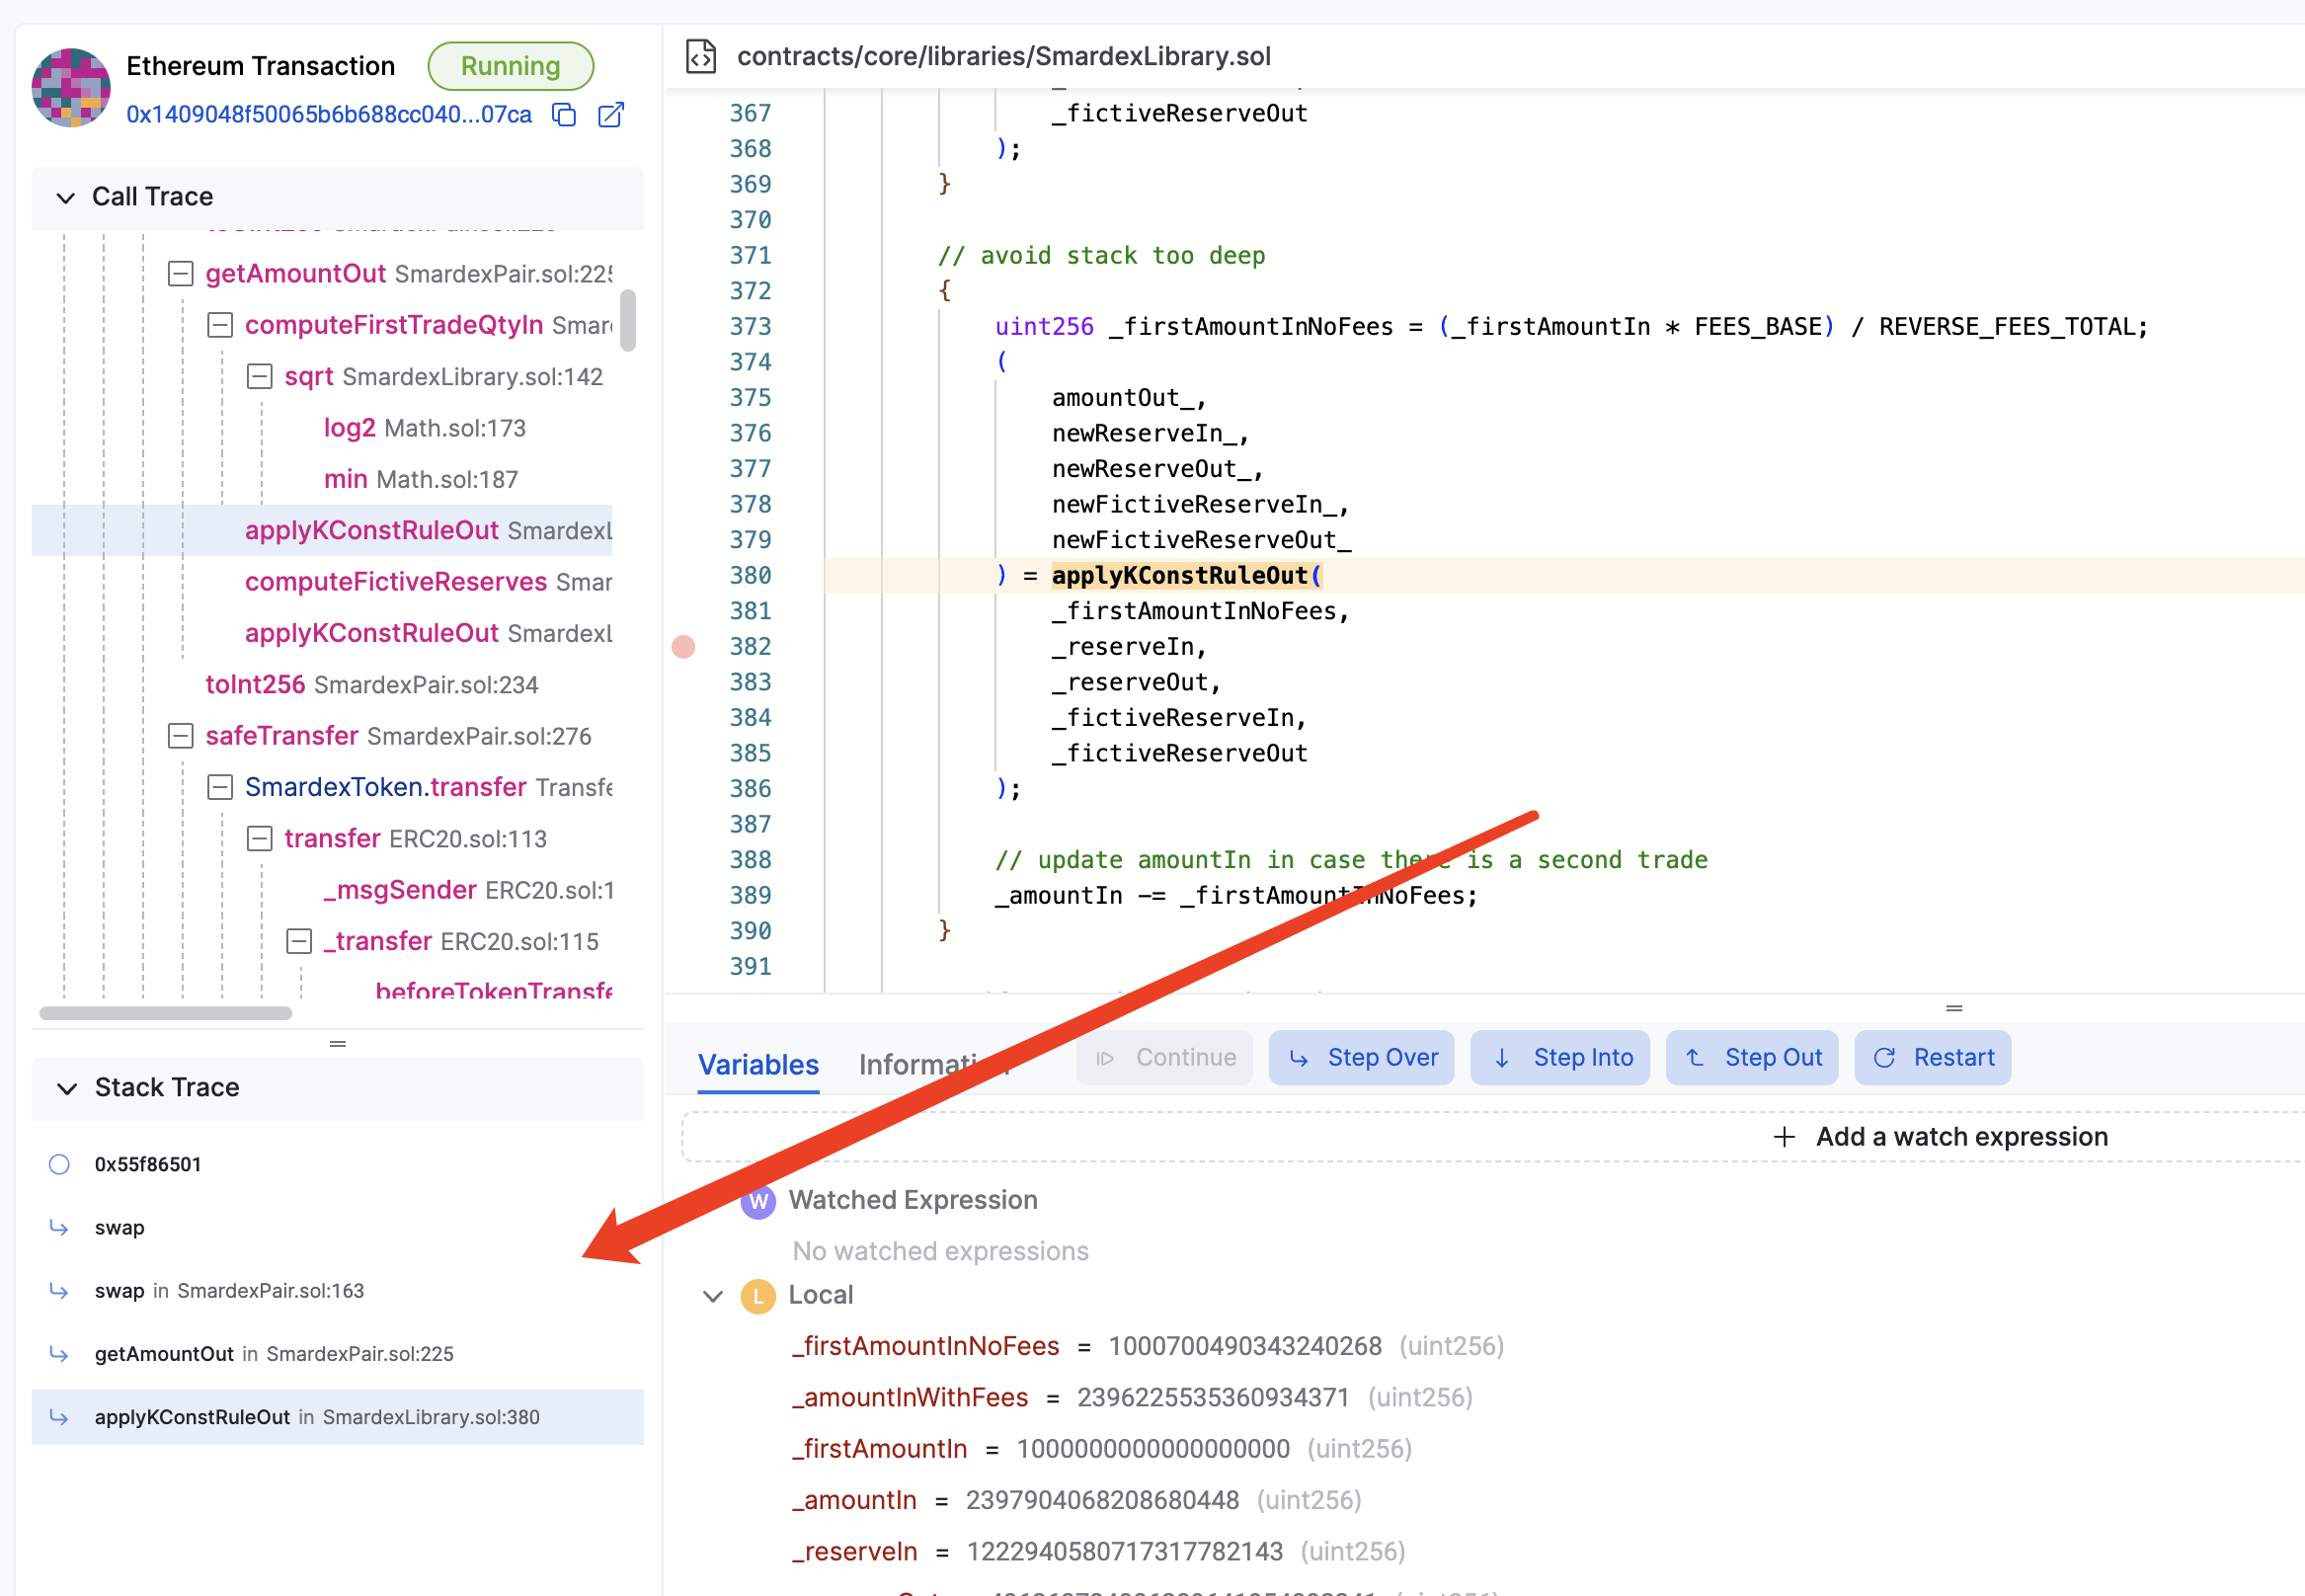
Debugger tab layout
Traces
On the upper-left section, Sentio shows the trace of the transaction, this is the same as trace and call. Users can use this to select a location and execute directly to that position.
Stack Traces
The bottom-left section contains the current call stack information, for example:
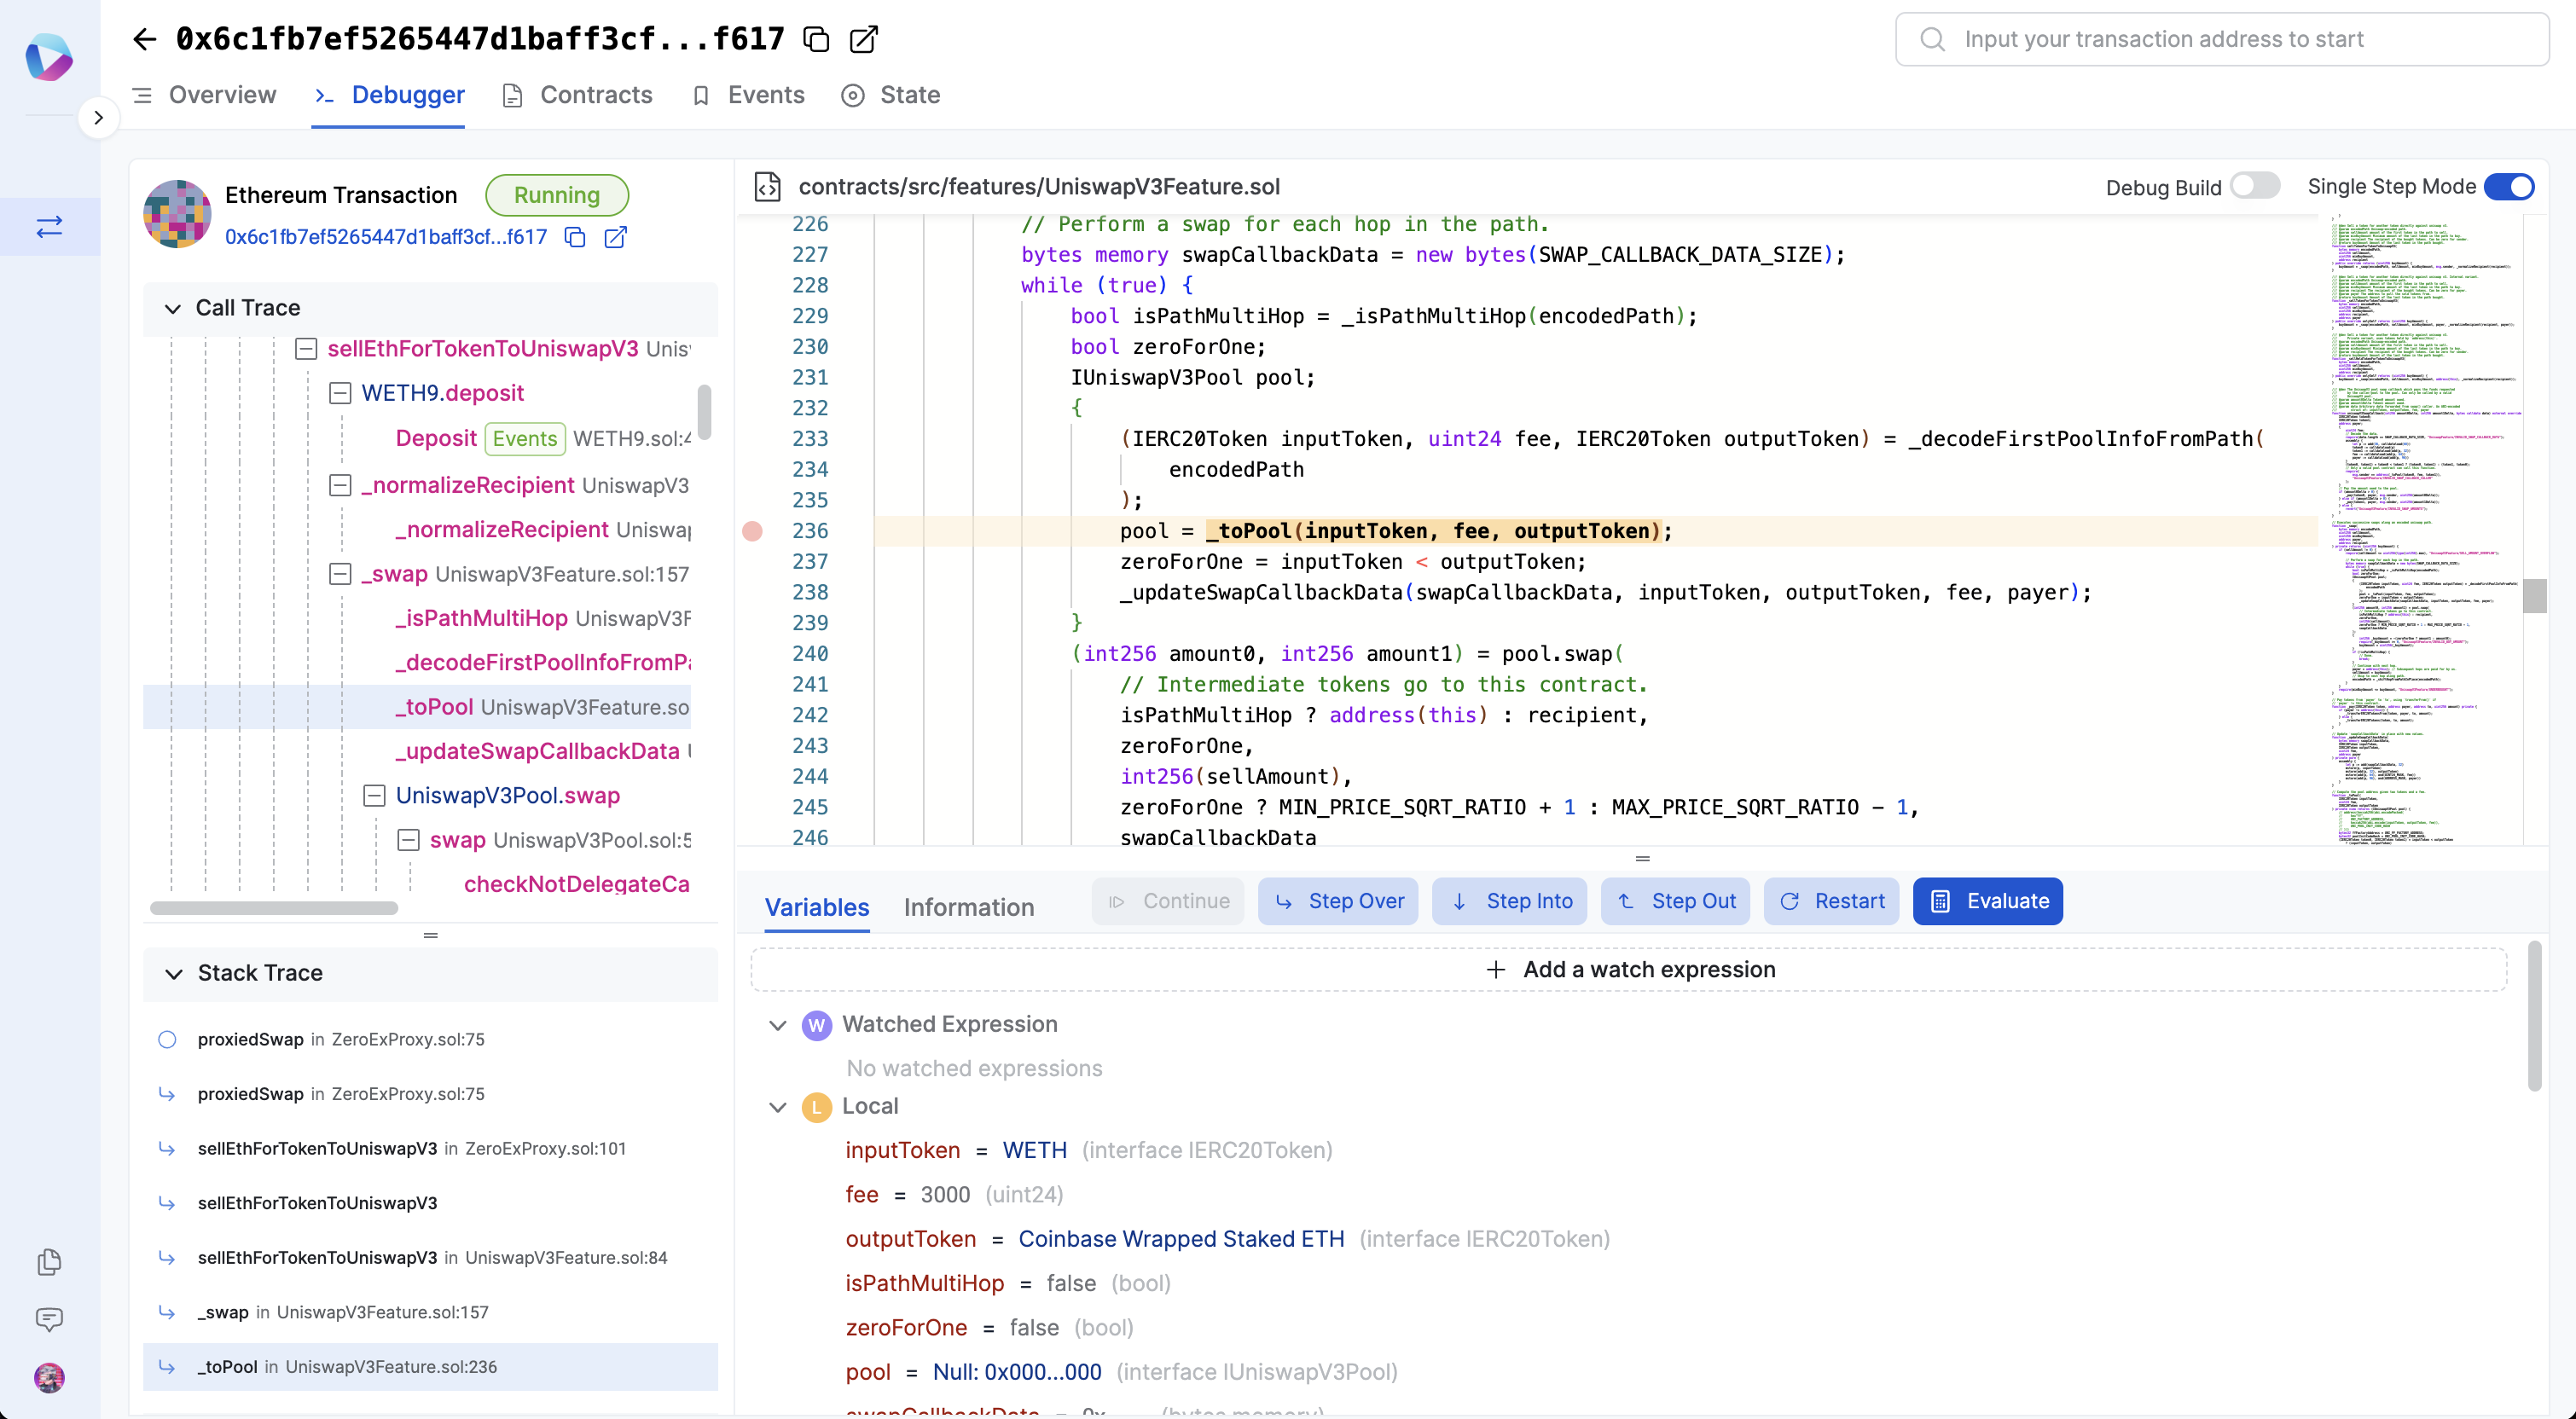
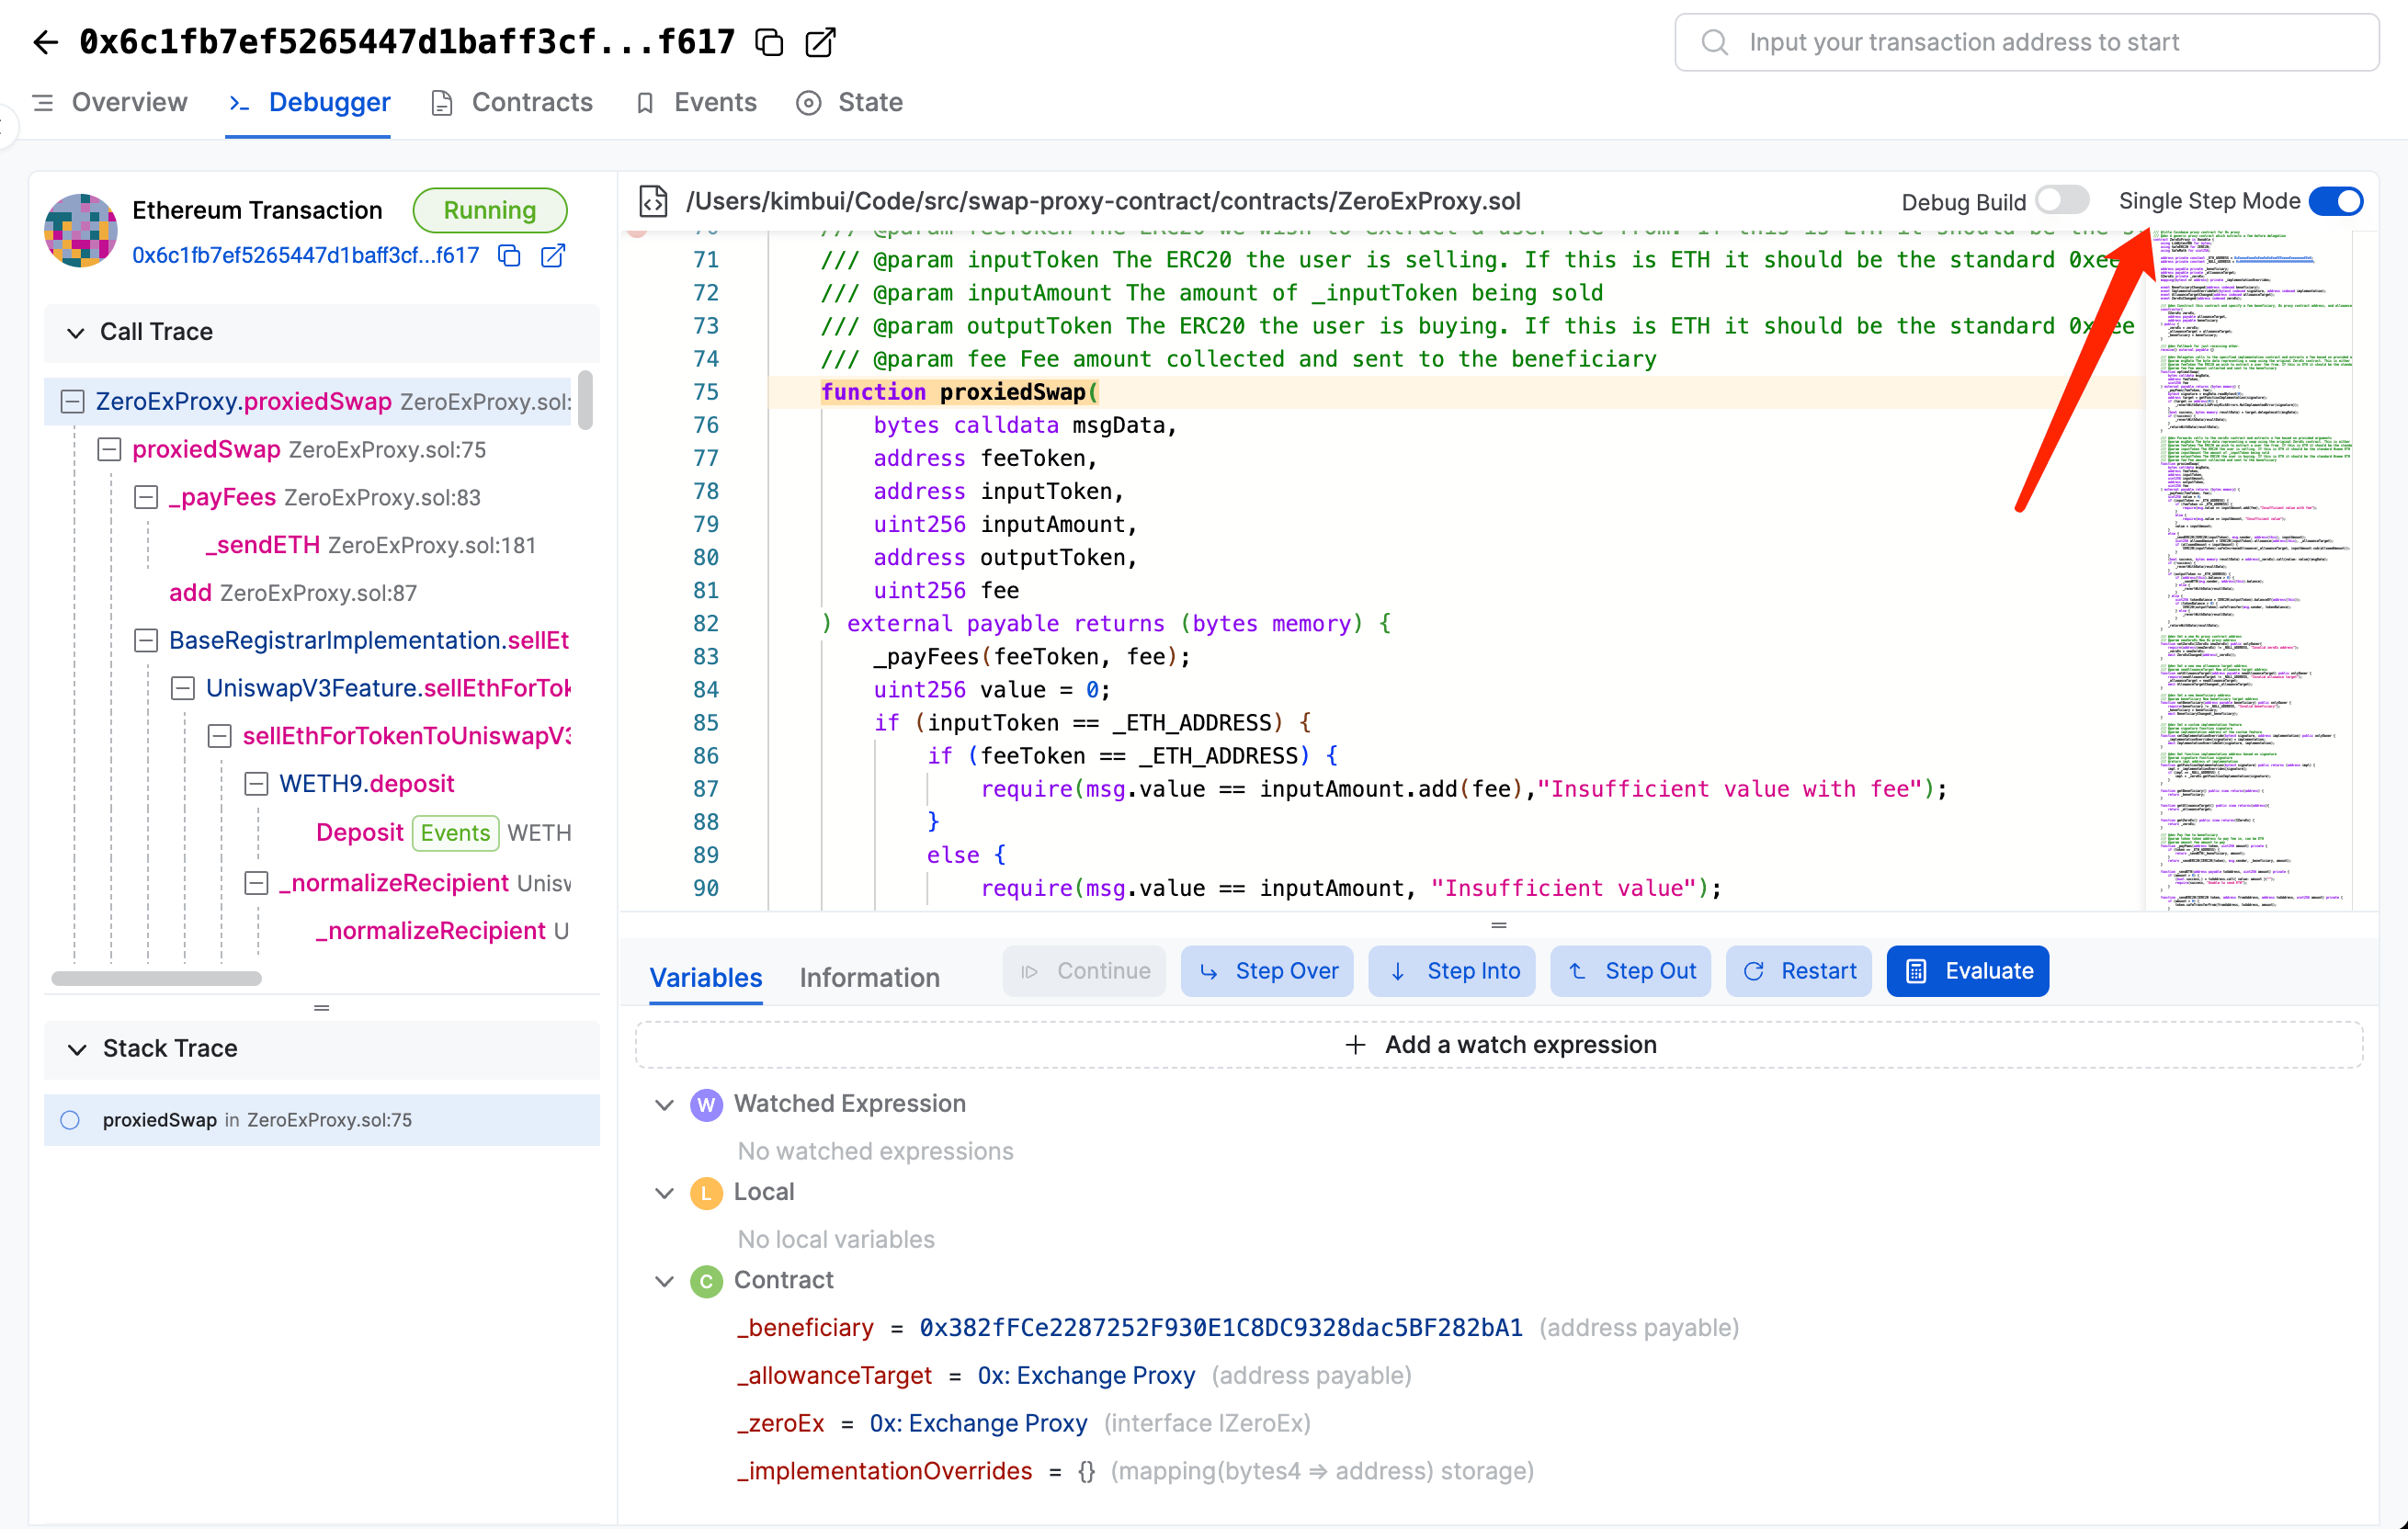
Single-Step Mode
To use single-step mode:
- Turn on single-step mode.
- (optional) Use Debug Build -- Sentio will recompile the contract with different compiler parameters to achieve the best source mapping. See Limitations below.
Use Debugger
The debugger has standard definitions of:
- Step-Over: Move to the next line of execution.
- Step-Into: If there is a function, steps into the function.
- Step-Out: If we are in a function, steps out the function to the upper level.
- Continue: This is the standard break-point.
- Restart: Restart from the beginning.
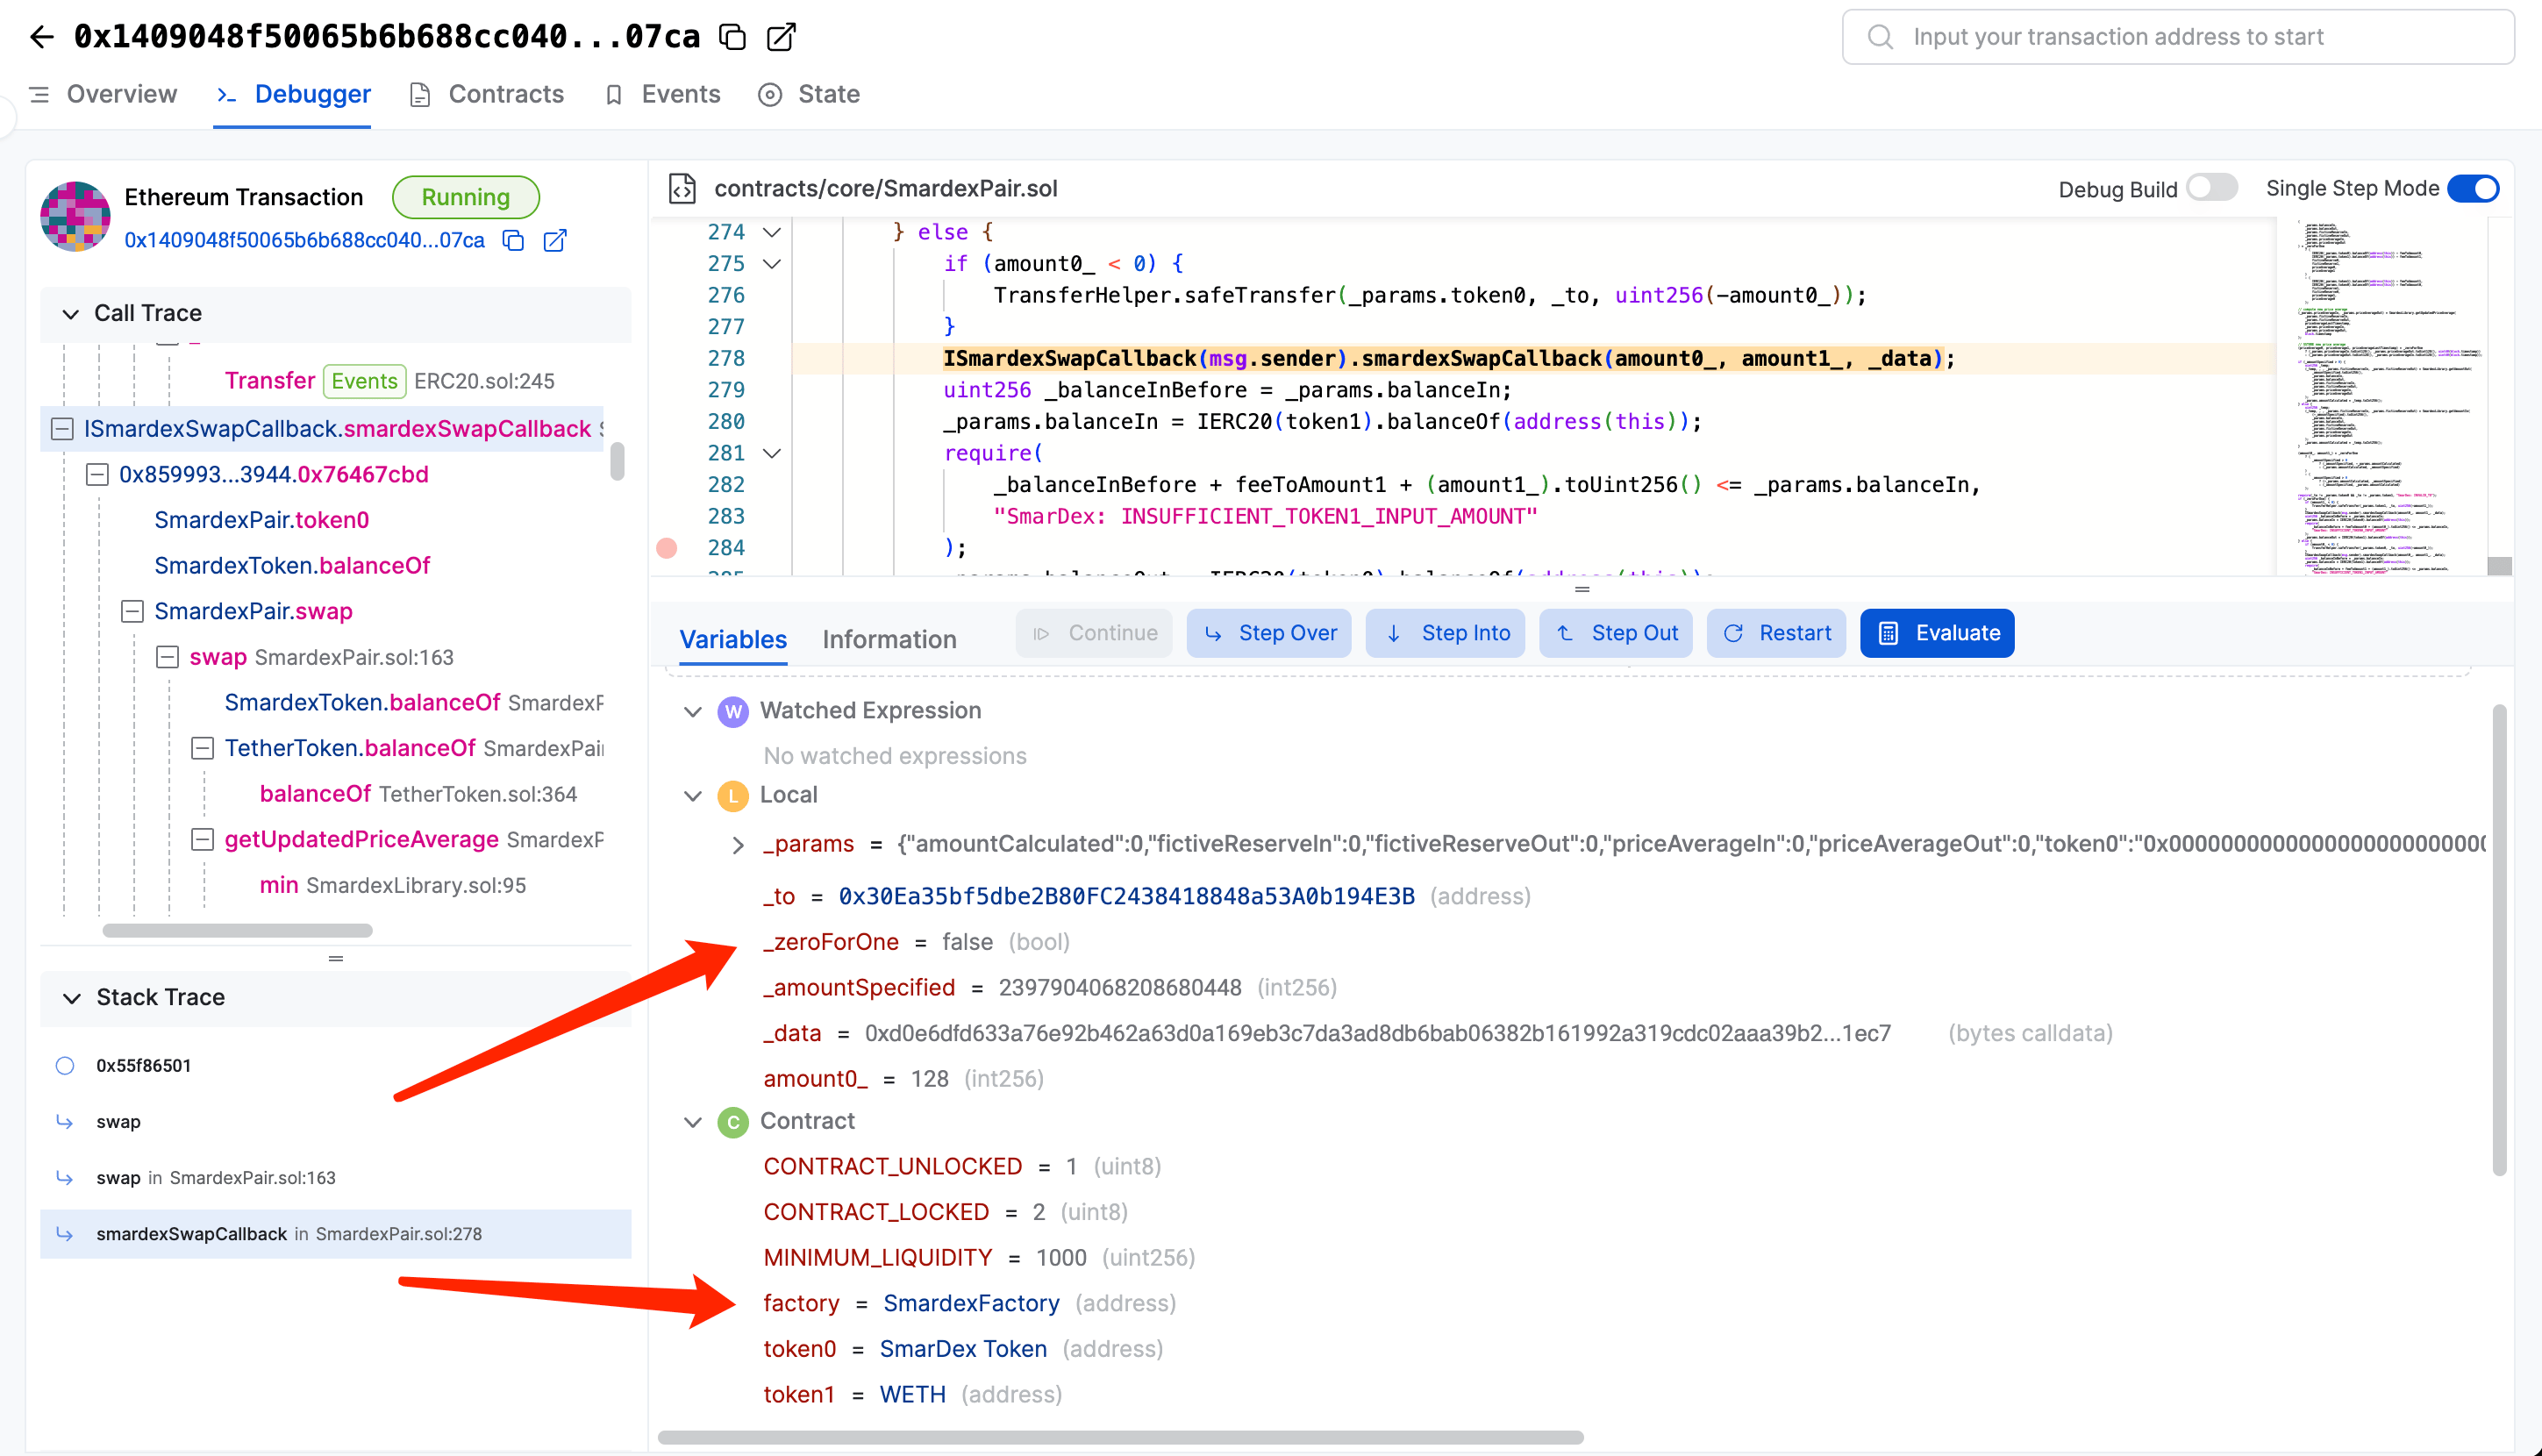
Inspect Variables
The debugger automatically shows the local variables within the call context, and all the contract variables.
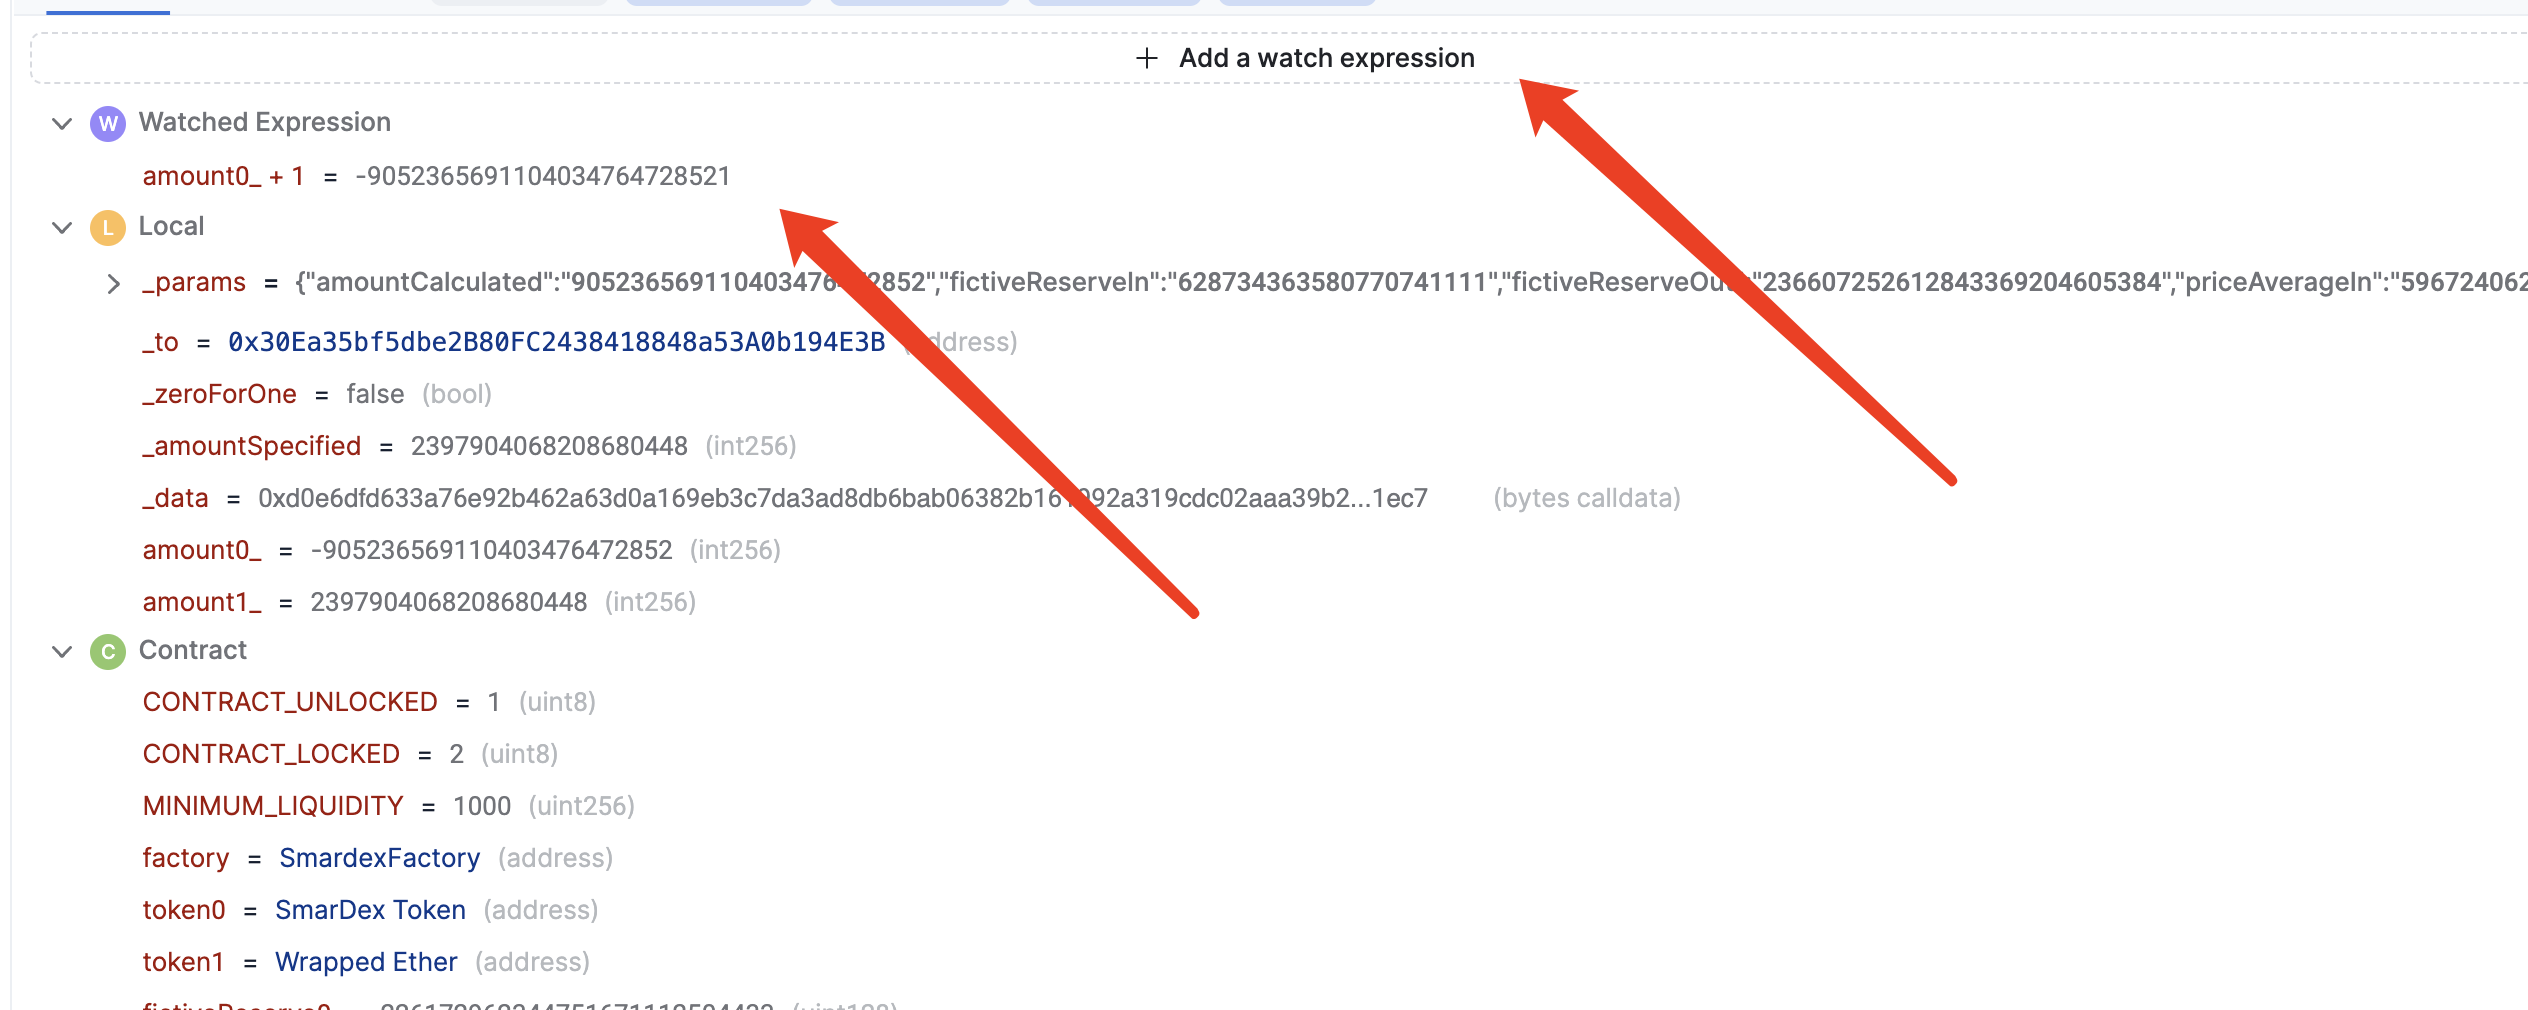
The debugger also supports adding user defined watched variables (similar to a regular debugger.)
Limitations
- Contracts compiled with the viaIR option are not fully supported.
- When debugging a release build, since they are fully optimized, source-mapping issues and unexpected execution orders may present themselves.
- When debugging a debug build, gas usage is ignored, which may cause different code execution. e.g. if the original transaction runs out of gas, the debug build will indicate the transaction fully executes.
Function-only Mode
If single-step mode is turned off, the debugger will behave at the function level.
Use the debugger
The debugger has standard definitions of:
- Next: proceeds to the next function call (depth first search order)
- Previous: reverts to the previous function call
- Step Over: proceeds to the next function call (does not follow nested calls)
- Step Up: goes up one level
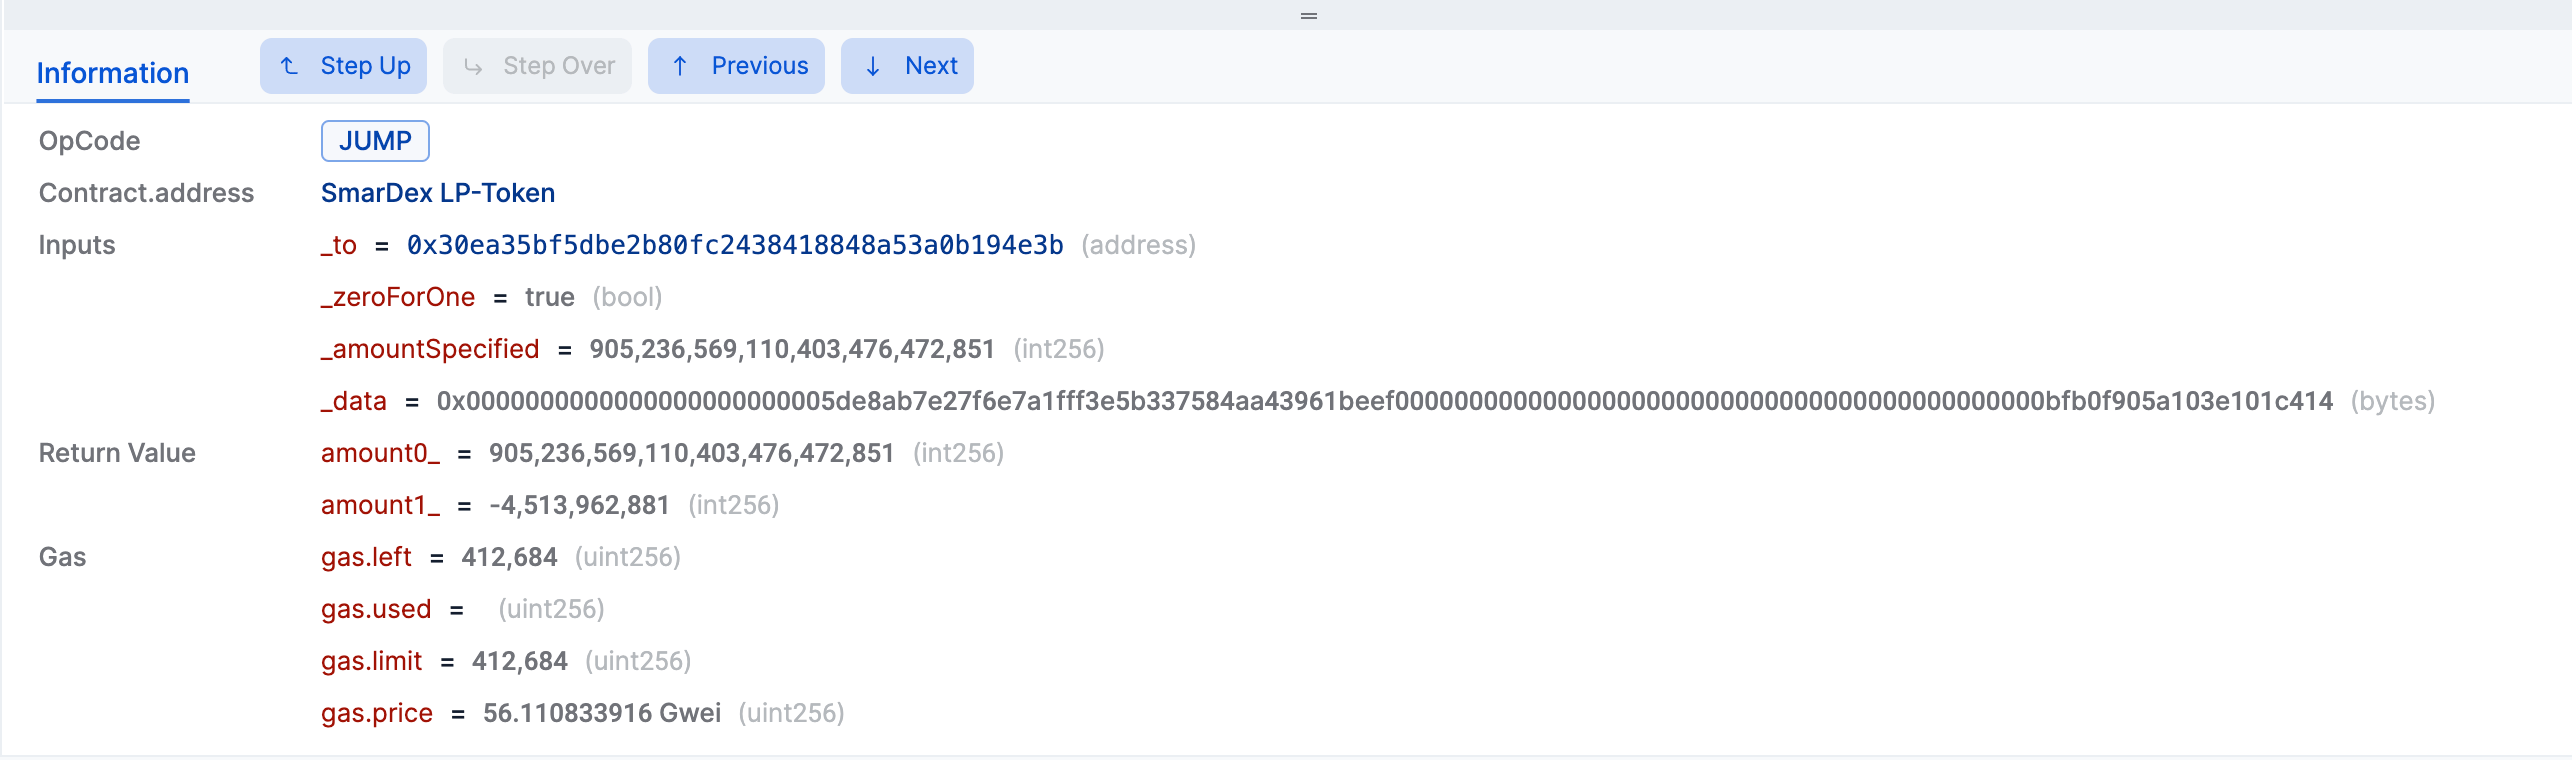
Inspect the variables
In this mode, developers can visualize Inputs, Return Value and Gas info.
Simulation
The Sentio simulator allows you to run simulations and analyze the data collected in great detail. You can quickly begin simulations through the Sentio UI or by calling the API.
Simulation UI
From existing transaction The simplest way to start a simulation is to click the simulator button as shown below, on a transaction that has been opened.
In this case, it will copy all the parameters from the existing transaction and you could make adjustments on top of it. Like block number, block index, gas fee, block header, state, etc.
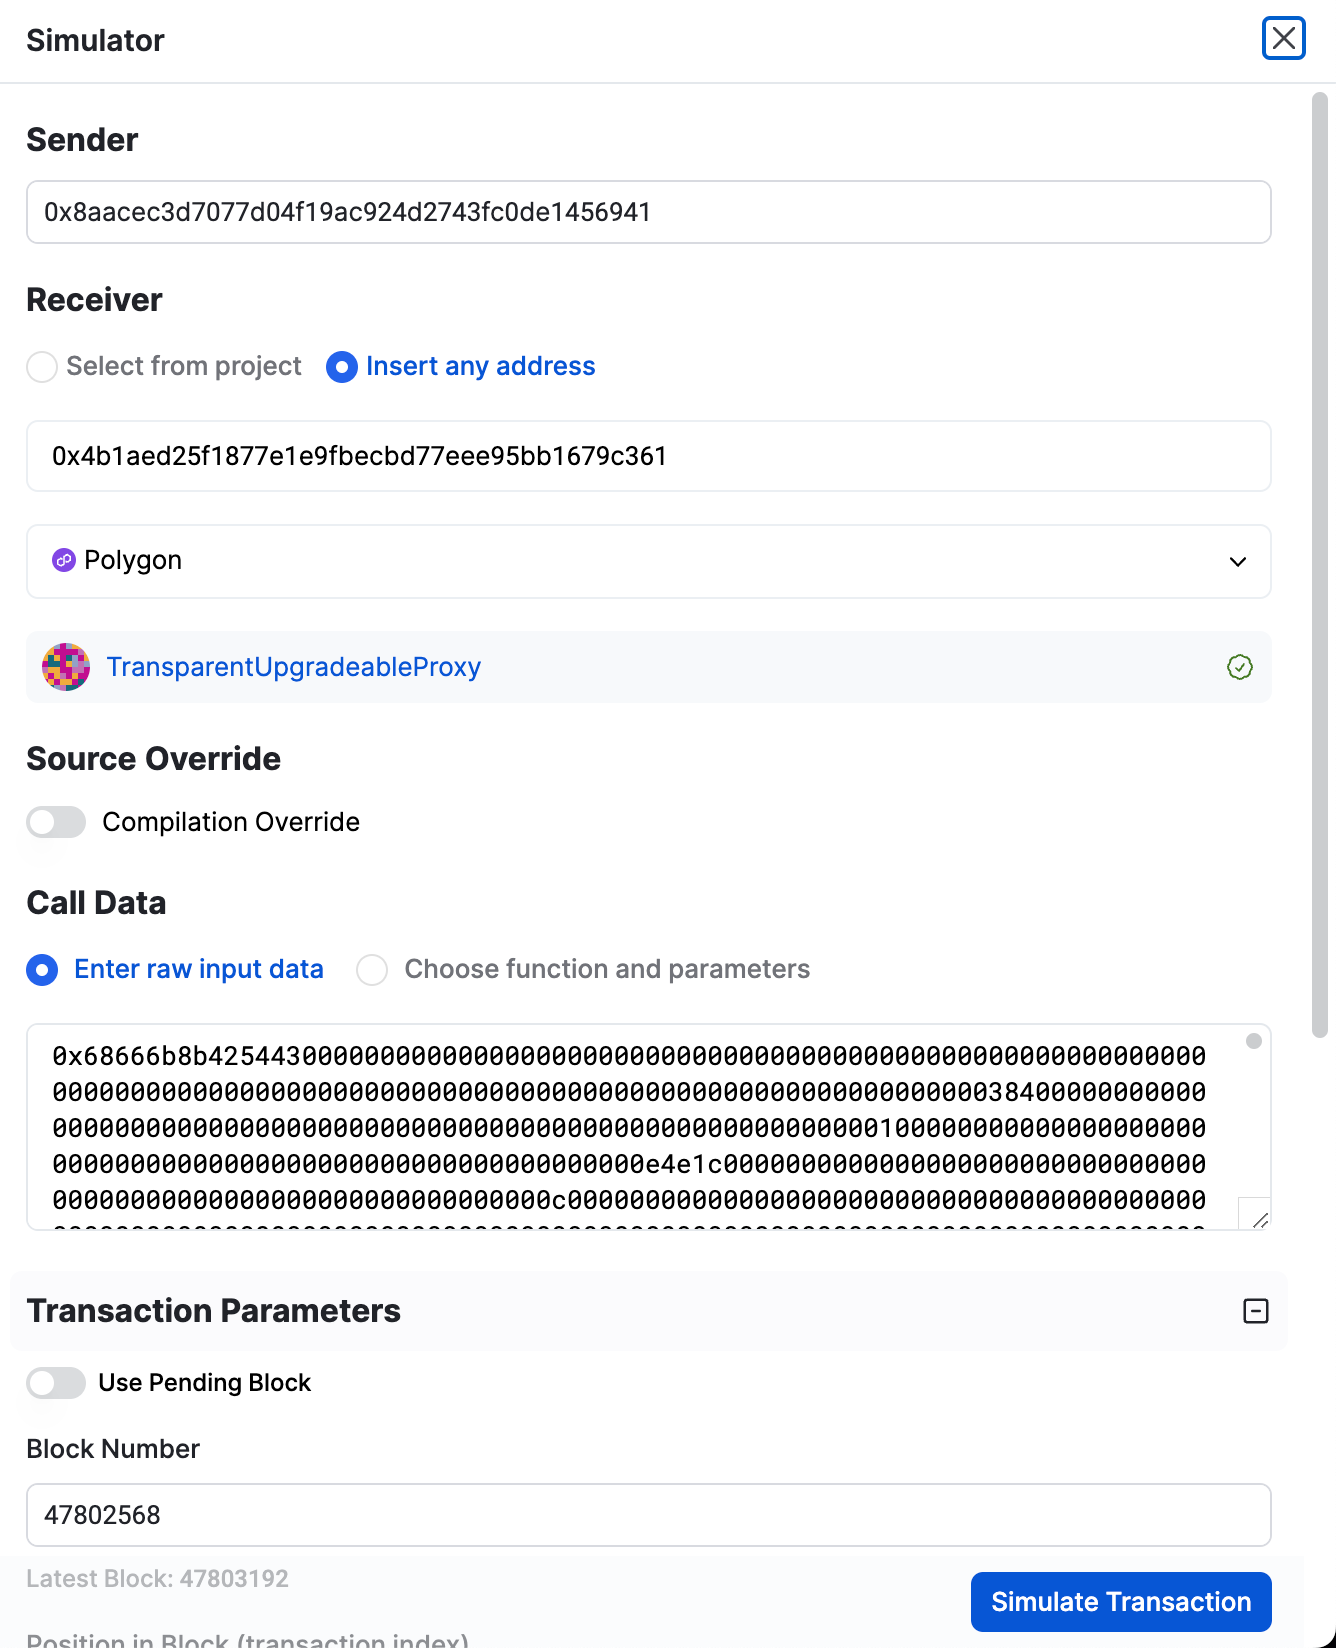
Click the simulate transaction button will save this run to the simulation history of your project and show you the result, just like what you see from the normal debugger UI.
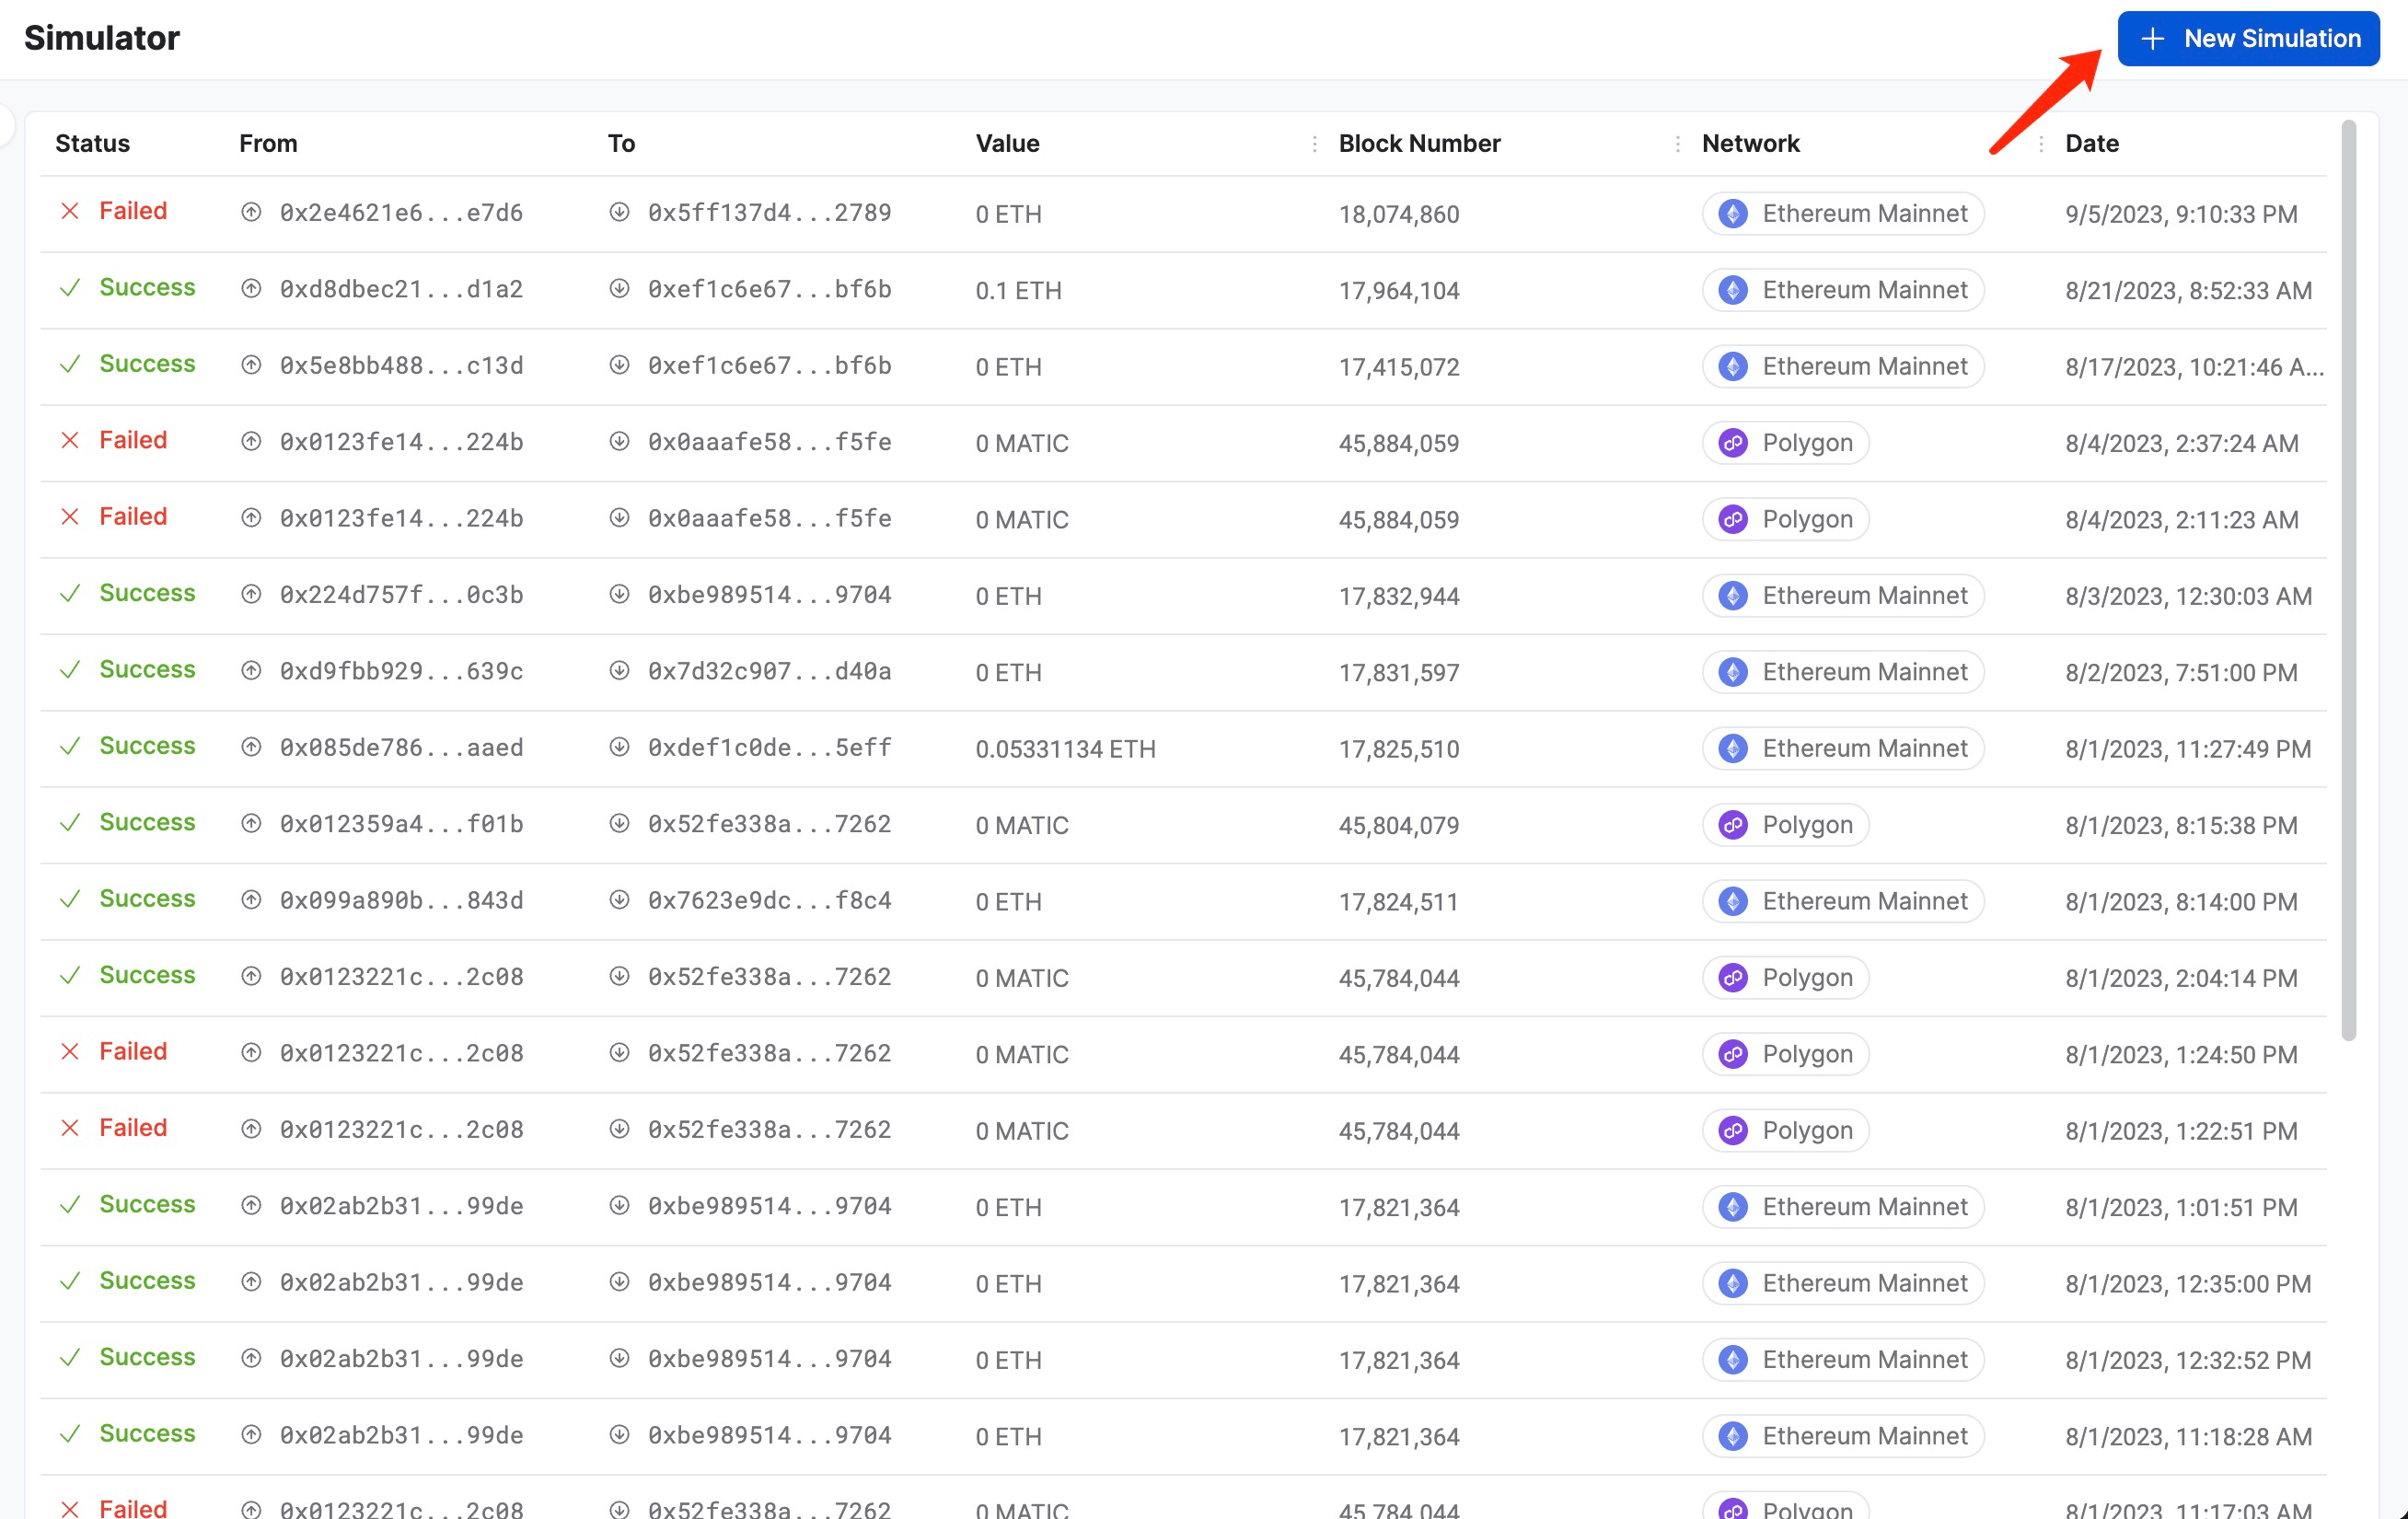
Direct Build
You can also click the simulator button on the left navigation bar and go to the simulator page which shows all the history simulations. Click the simulation button on the right corner will pop a similar UI but without prepopulated transaction data.
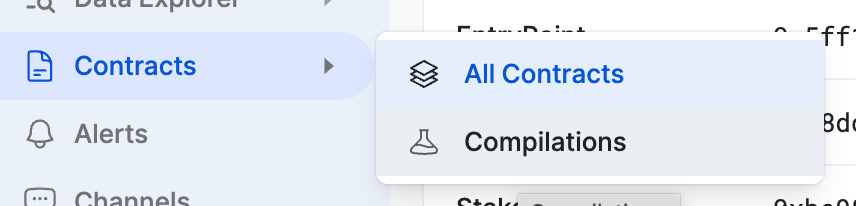
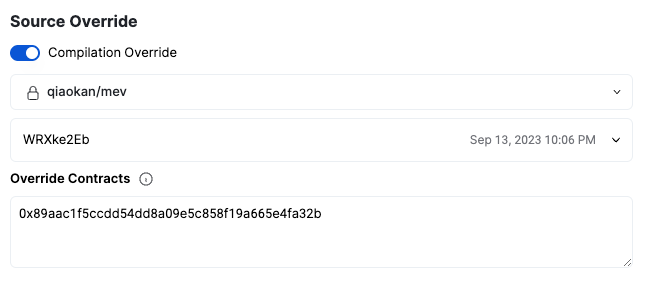
Override Contract
Use the compilations tab to upload a local contract compilation folder.
When doing the simulation, choose the contract override.
Simulation API
Create Simulation
For all simulation API calls, you should have an API key, and pass it by header with the field api-key. Refer to API Key for how to obtain one.
The simulation body should be included in the request body. You can follow the example below.
curl --location 'https://app.sentio.xyz/api/v1/solidity/simulate' \
--header 'api-key: <API_KEY>' \
--header 'Content-Type: application/json' \
--data '{
    "projectOwner": "<USER>",
    "projectSlug": "<PROJECT>",
    "simulation": {
        "networkId": "1",          // Chain ID, "1" for Ethereum mainnet. See chainlist.org for details
        "blockNumber": "17415072",
        "transactionIndex": "97",  // transaction index in the block

        // standard field for evm transactions
        "from": "0x5e8bb488e85ea732e17150862b1acfc213a7c13d",
        "to": "0xef1c6e67703c7bd7107eed8303fbe6ec2554bf6b",
        "value": "0x0",
        "gas": "0x31ae2",
        "gasPrice": "0xe59a1adbe",
        "input": "0x3593564c000000000000000000000000000000000000000000000000000000000000006000000000000000000000000000000000000000000000000000000000000000a000000000000000000000000000000000000000000000000000000000647dffef0000000000000000000000000000000000000000000000000000000000000002080c000000000000000000000000000000000000000000000000000000000000000000000000000000000000000000000000000000000000000000000000000200000000000000000000000000000000000000000000000000000000000000400000000000000000000000000000000000000000000000000000000000000160000000000000000000000000000000000000000000000000000000000000010000000000000000000000000000000000000000000000000000000000000000020000000000000000000000000000000000000003077b58d5d378391980000000000000000000000000000000000000000000000000000000032b2ced3e40e9d100000000000000000000000000000000000000000000000000000000000000a000000000000000000000000000000000000000000000000000000000000000010000000000000000000000000000000000000000000000000000000000000002000000000000000000000000082646b22a3960da69ef7a778c16dd6fb85dd999000000000000000000000000c02aaa39b223fe8d0a0e5c4f27ead9083c756cc200000000000000000000000000000000000000000000000000000000000000400000000000000000000000000000000000000000000000000000000000000001000000000000000000000000000000000000000000000000032b2ced3e40e9d1",

        // overrides
        "stateOverrides": {
            "0x0811fd1808e14f0b93f0514313965a5f142c5539": {
                "balance": "0x1111111111111111"
            }
        },
        "blockOverride": {
            "baseFee": "0x0"
        }
    }
}'
Your simulations will be saved, and a unique ID for each simulation is included in the response. It will be useful for fetching simulation details.
Get Detail Trace
State Diff Endpoint: https://app.sentio.xyz/api/v1/solidity/state_diff API key is required.
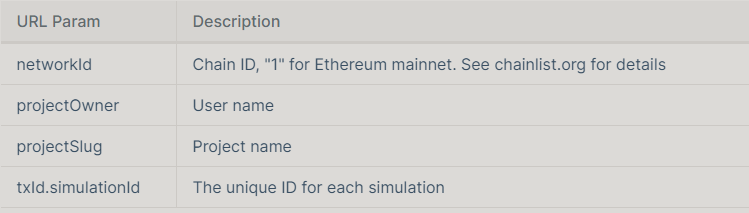
Example:
curl --location 'https://app.sentio.xyz/api/v1/solidity/state_diff?networkId=1&txId.simulationId=pVwBCxr3&projectOwner=<USER>&projectSlug=<PROJECT>' \
--header 'api-key: <API_KEY>'
Trace Decoded Trace
Endpoint: https://app.sentio.xyz/api/v1/solidity/call_trace API key is required.
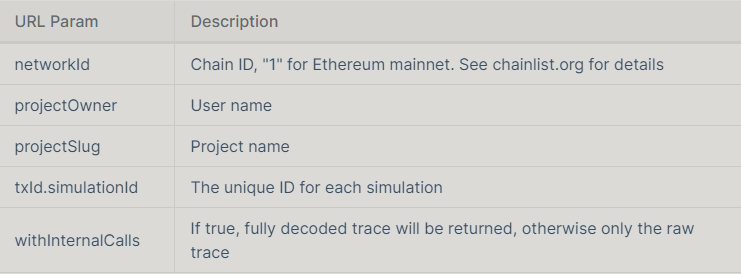
Example:
curl --location 'https://app.sentio.xyz/api/v1/solidity/call_trace?withInternalCalls=true&networkId=1&txId.simulationId=pVwBCxr3&projectOwner=<USER>&projectSlug=<PROJECT>' \
--header 'api-key: <API_KEY>'
For more information about Sentio Debugger and for information not listed here, visit their official documentation page.